Smart Factory
The Smart Factory App leverages the Value Sensitive Design (VSD) framework to create a user-centric platform for managing industrial operations. Focusing on user needs, it integrates real-time data monitoring, task management, and performance analytics, enhancing productivity and promoting an ethical work environment.
Project Type
UX/UI
Timeline
2 Months
Concept
Value Sensitive Design

My Role
UX Research
UX Designer
UI Designer
Usability Tester
ToolKit
Pen & Paper
Figma
FigJam
Miro
Target Audience
Factory & Logistics Workers
Floor Managers and Supervisors
Quality Control Specialists
Factory Administrators
Project Overview
Approach Followed

Ideation
Brainstorming, Supervisor discussions.

Foundational Research
Research Papers, articles, exisiting projects.
Paper Wireframing
Pen and paper, crazy 8

High-fidelity Wireframing
Concepts into detailed, interactive prototypes that closely resemble the final product

Digital Prototyping
Realistic, interactive prototypes that brought digital concepts to life via Figma.

Testing ensured app is intuitive, user-friendly, and meets the needs of your audience.
Usability Testing
UX Research Study
discovery & exploration
#1 Ideation
The ideation phase of the Smart Factory project focused on creating an efficient, user-centered solution for industrial operations. Collaborative discussions with industry experts, professors, and peers helped identify key pain points, including data overload, task prioritization, and lack of real-time insights.
This phase laid the foundation for an innovative solution addressing the diverse needs of factory stakeholders.
User Personas

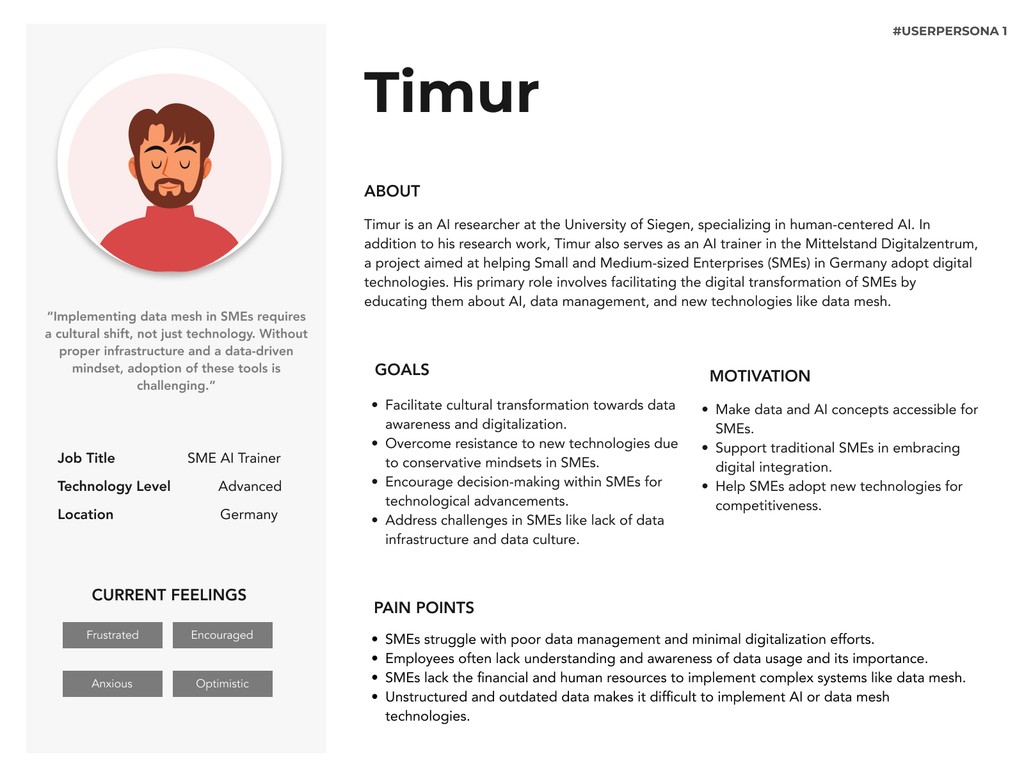
User interviews were conducted to explore factory operational challenges among workers and employees.
Two men participated in remote interviews via Google Meet.
The qualitative and quantitative insights and the observations gathered were used to create two detailed personas.
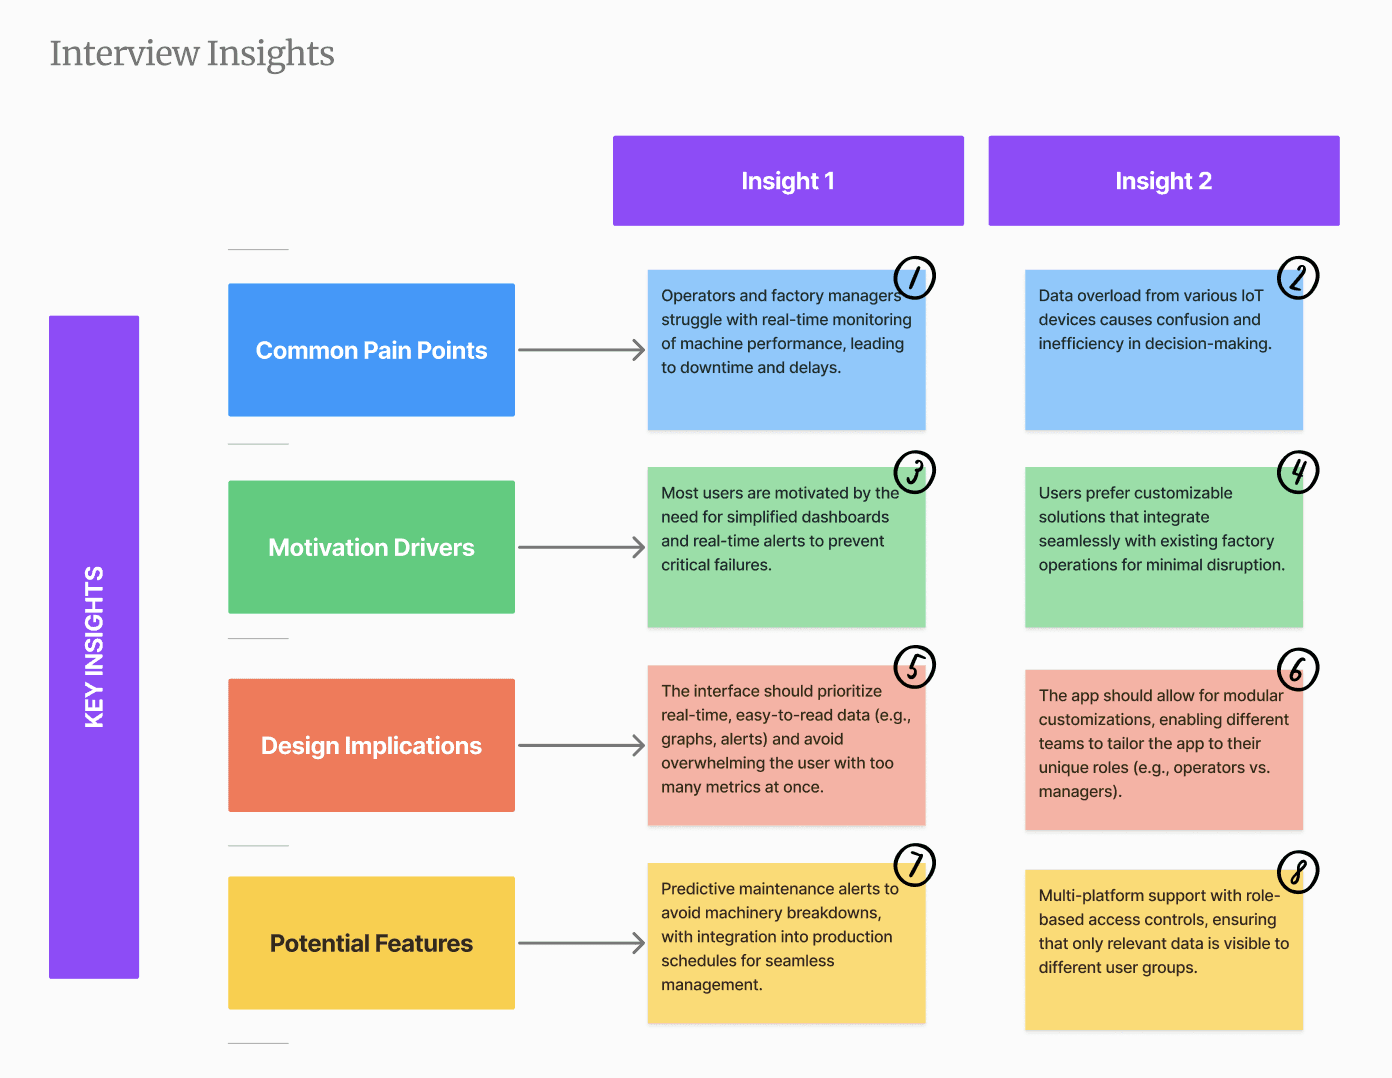
Interview Outcome
#2 User Interview
Identified Key User Needs: Users require a streamlined solution for real-time machine monitoring, predictive maintenance, and integrating diverse IoT data into a single, easy-to-use dashboard to enhance operational efficiency.
Defined Core Pain Points: Users struggle with data overload, ineffective monitoring systems, and unplanned machinery downtime, leading to production delays and decreased efficiency.
Develop Solution Concepts: Focus on creating a customizable app that offers real-time alerts, predictive analytics, and modular customization to fit different roles within the factory environment, ensuring a seamless user experience across diverse use cases.
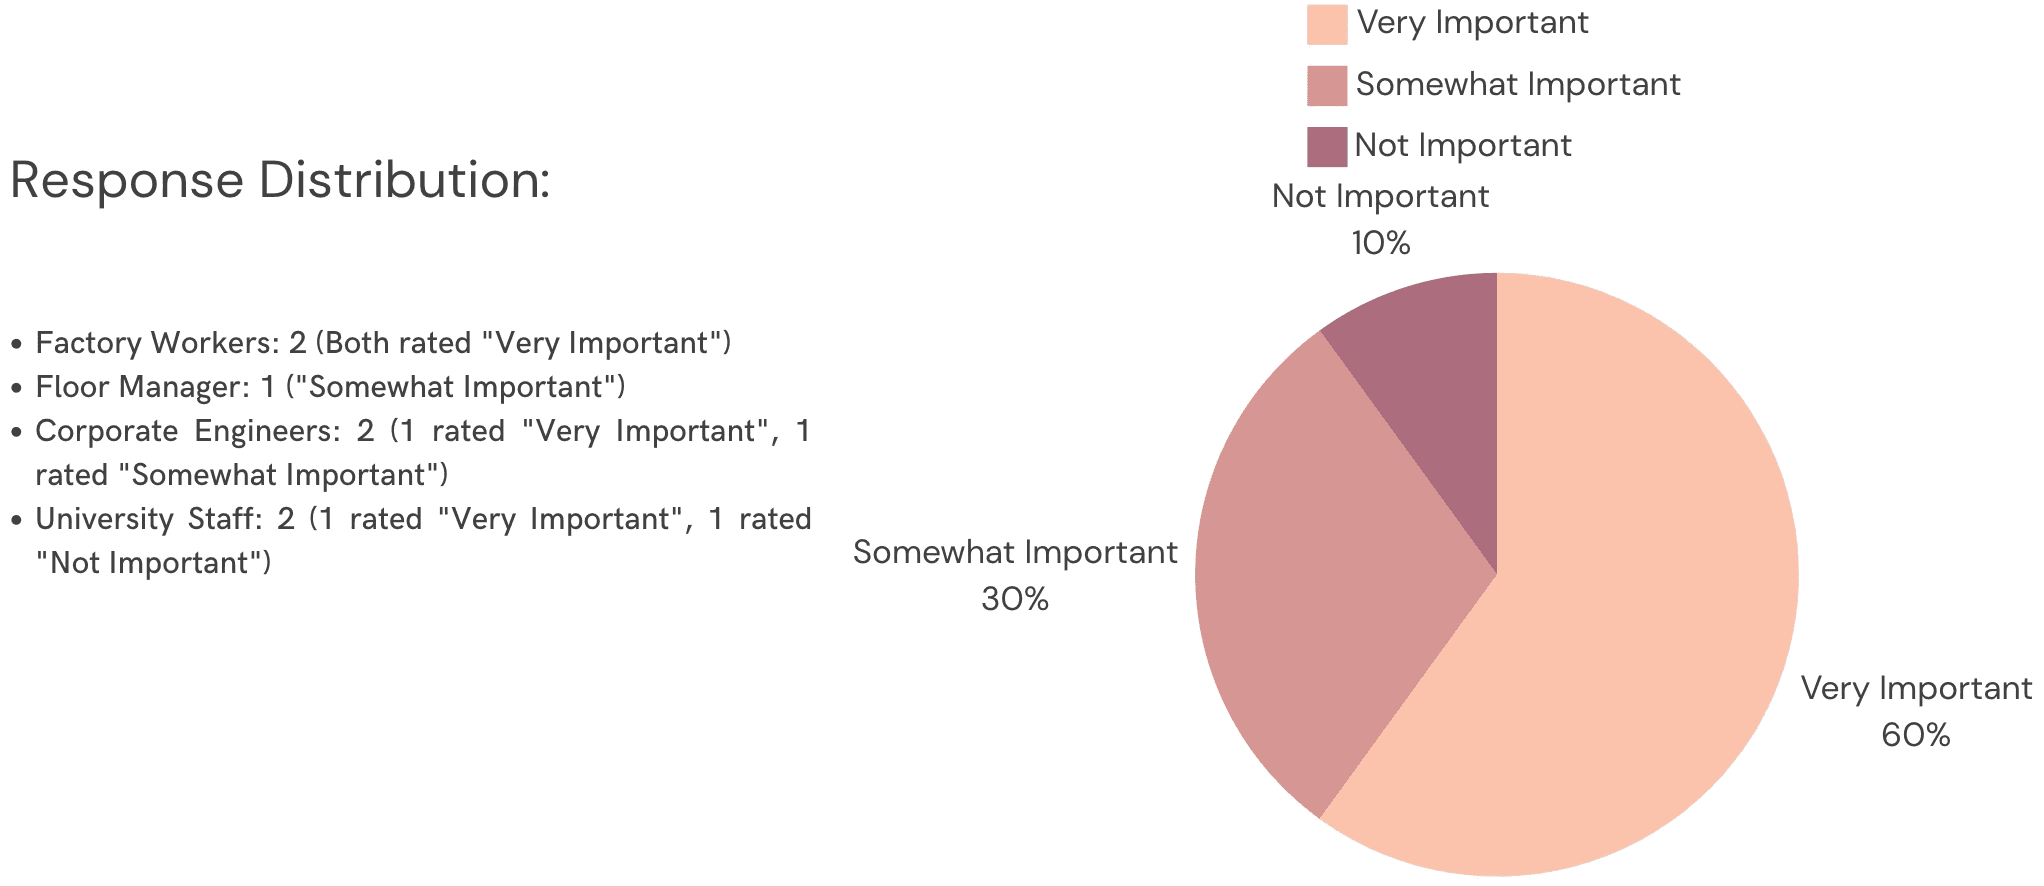

As part of the Smart Factory App development process, we conducted a survey to gather insights from 7 participants which included factory workers, floor managers, corporate engineers, and university operational staff. The primary goal of the survey was to understand user needs, pain points, and preferences related to real-time machine monitoring, predictive maintenance, and data integration in factory environments.
Survey Overview
Participants’ Response:
Factory Workers (2)
Floor Manager (1)
Corporate Engineers (2)
University Staff (2)
Survey Question #1
How important is real-time monitoring for your factory's operations?
Survey Question #2
Which feature would most improve operational efficiency in your factory?
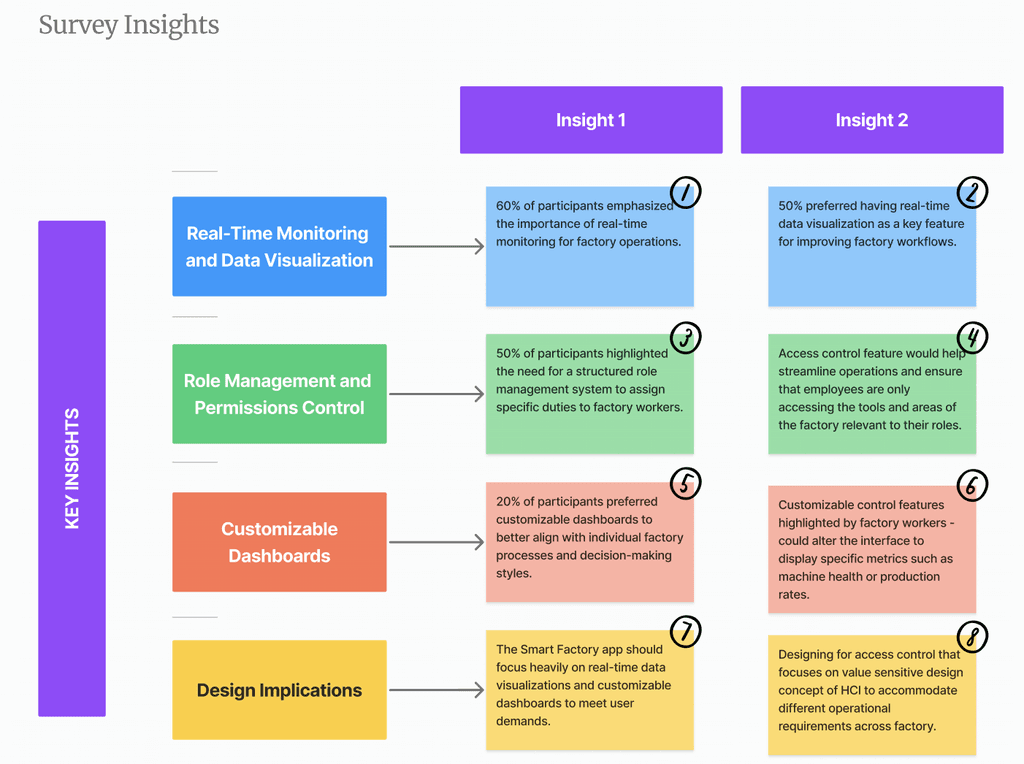
Survey Outcome
Strong Demand for Real-Time Monitoring: A significant portion of users emphasized the need for real-time data visualization to improve operational efficiency and decision-making.
High Importance of Role Management: Participants highlighted the necessity of assigning roles and managing permissions to ensure secure and optimized factory operations.
Customization is Key: Users expressed a preference for customizable dashboards, allowing them to tailor the interface to their specific needs and enhance workflow control.
#3 User Survey
Identified Key User Needs: Users require a task management solution that is both engaging and tailored to their specific motivations—whether it's reducing stress, enhancing productivity, or balancing work and personal life.
Defined Core Pain Points: Users struggle with distractions, overwhelming tasks, and ineffective prioritization, leading to procrastination and last-minute stress.
Develop Solution Concepts: Focus on creating a personalized task management tool that integrates humour, customizable reminders, and task breakdown features to address user-specific challenges and enhance overall productivity.
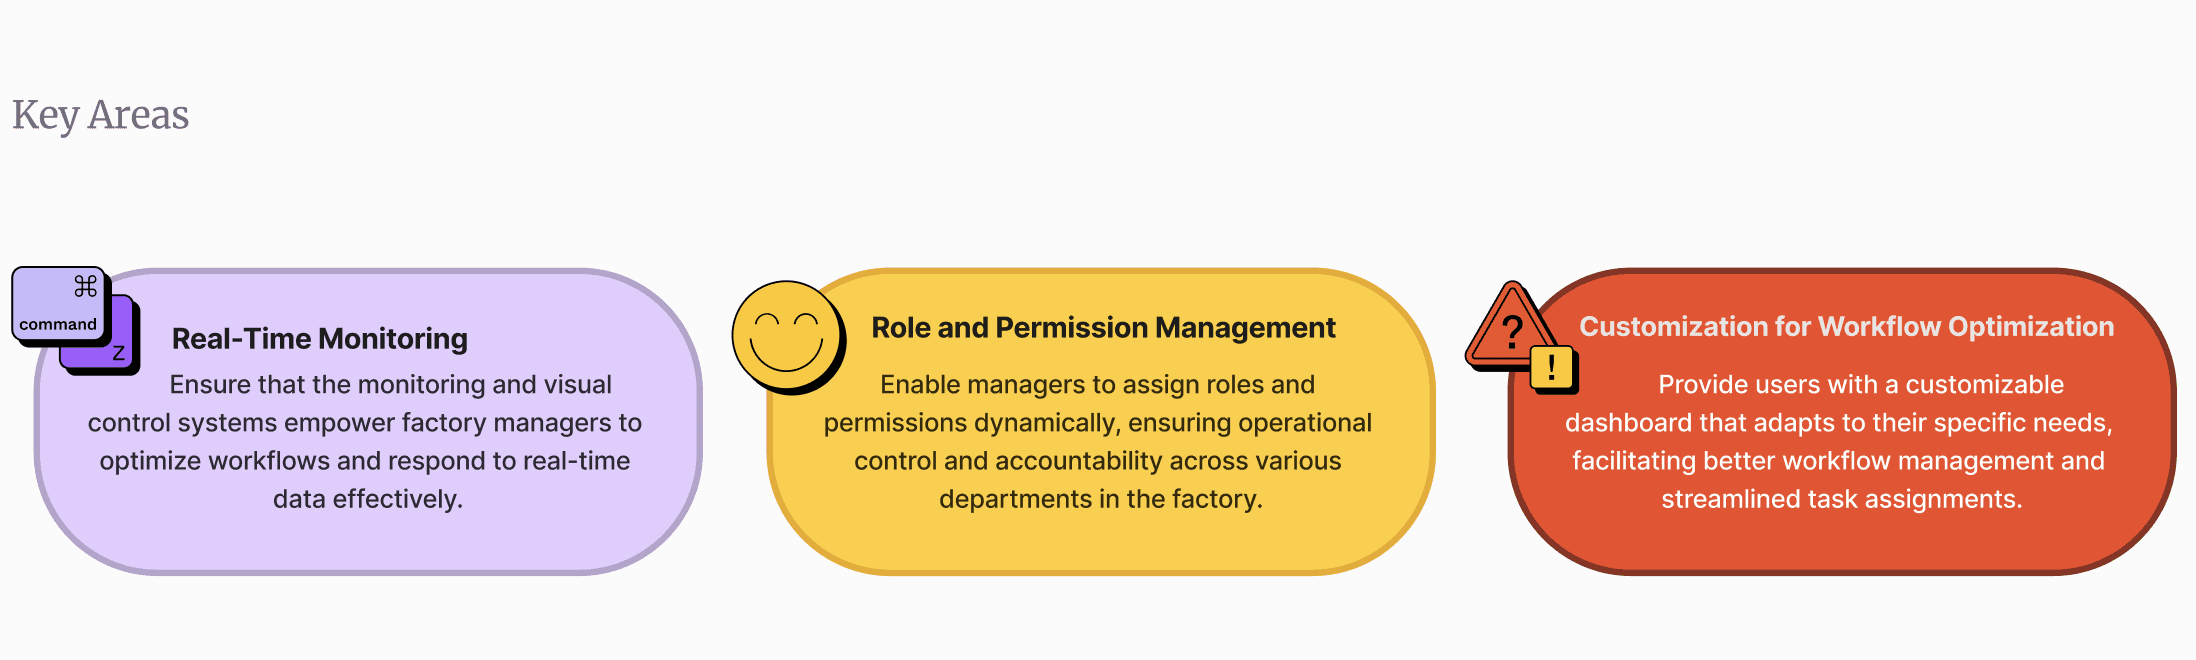
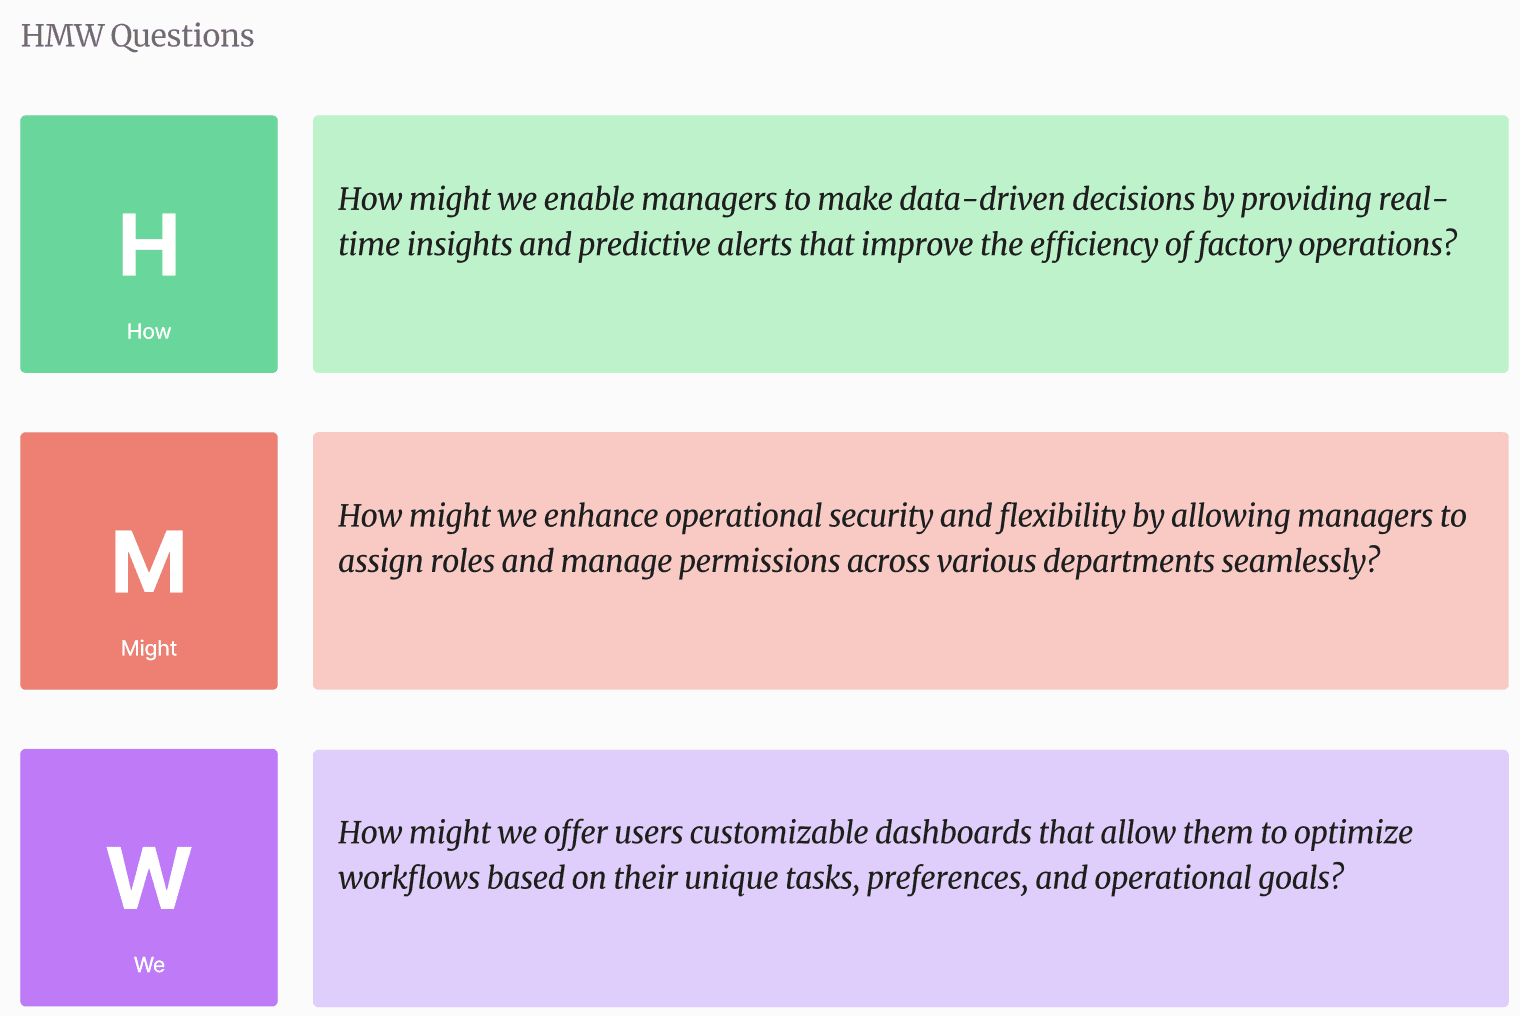
#4 How Might We (HMW) ?
The "How Might We?" question serves as the foundation for guiding the design and development of this smart factory project, addressing user pain points through innovative technology-driven solutions. This HMW question will encapsulate the core objectives of the project and provide a clear direction for designing solutions that solve real-world challenges.
The HMW question drives the development of the Smart Factory App by focusing on three key areas:
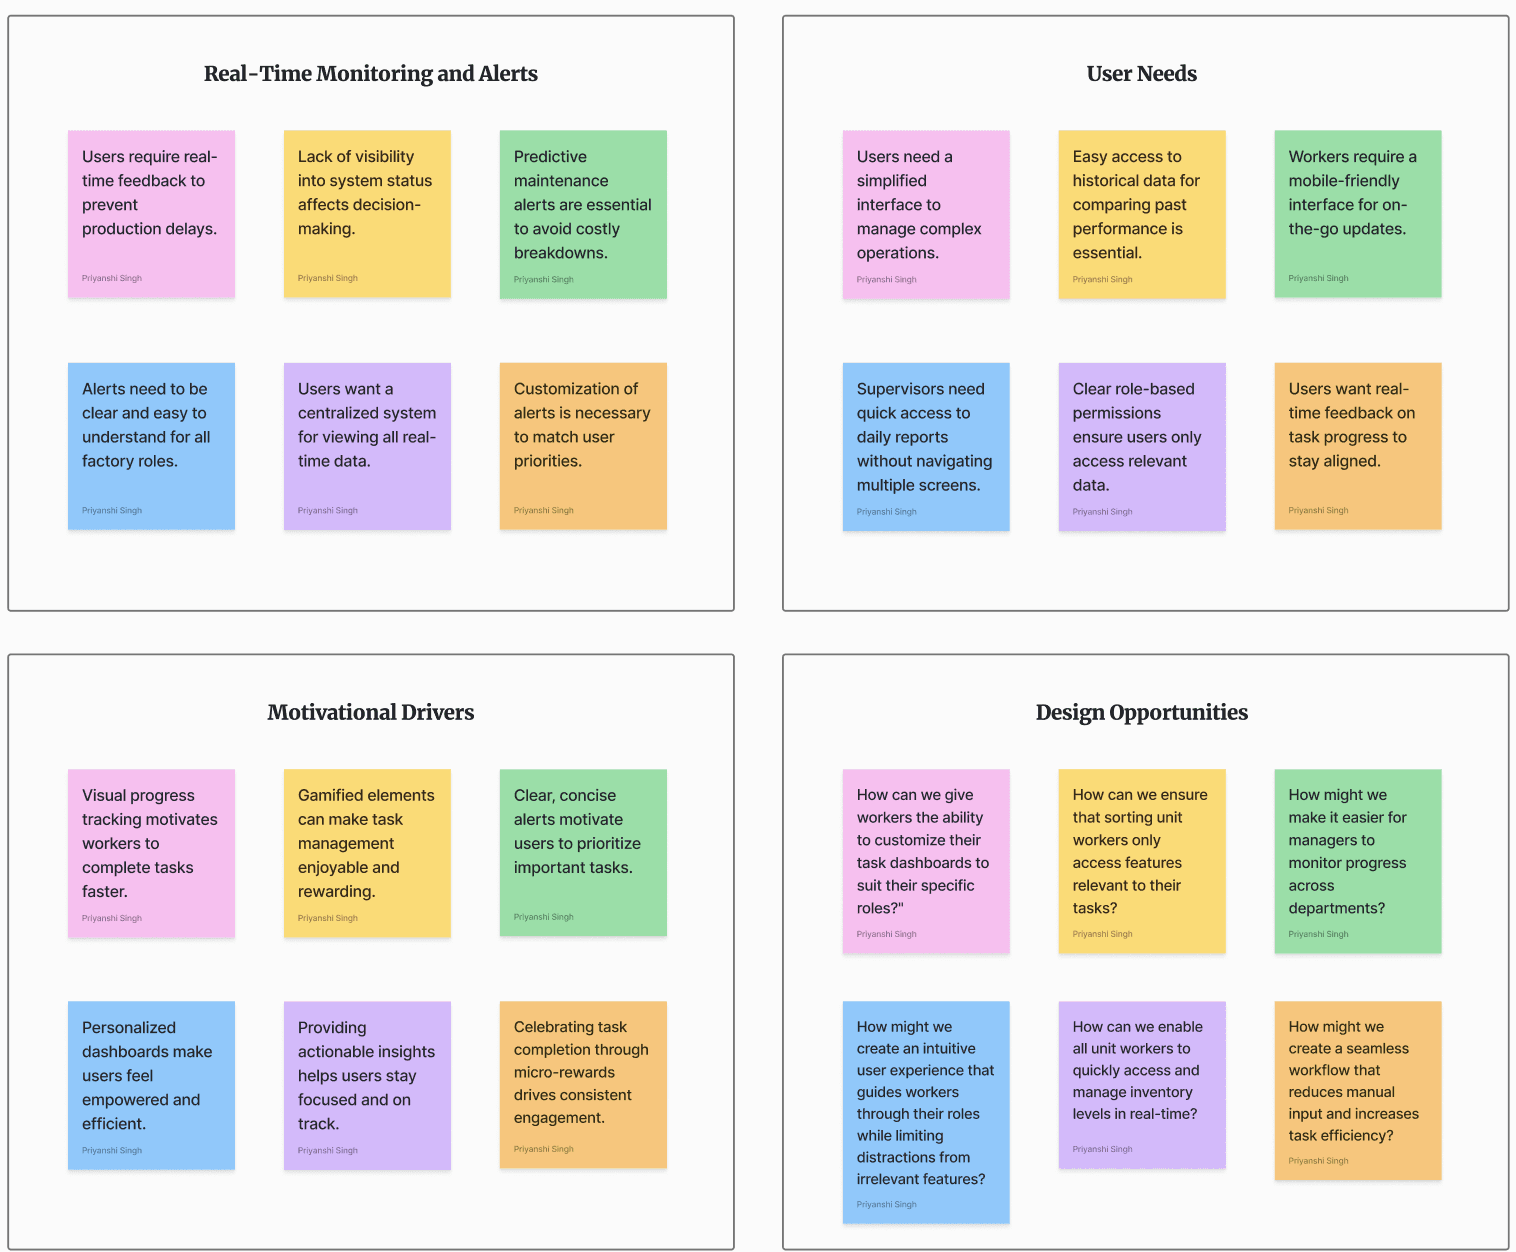
#5 Affinity Mapping
The goal of affinity mapping for this smart factory project is to categorize and analyze user insights from research, surveys, and feedback to uncover key pain points and opportunities in the current factory management processes.
I was able to describe the affinity map into four different categories.
#6 Competitive Analysis
The competitive analysis for this project app involves a UX-focused comparison of three popular apps—Monday.com, Tulip, and Trello. By evaluating key features, user interfaces, and functionalities, the analysis aims to identify opportunities and gaps that can inspire design improvements for a streamlined, user-centric app experience.
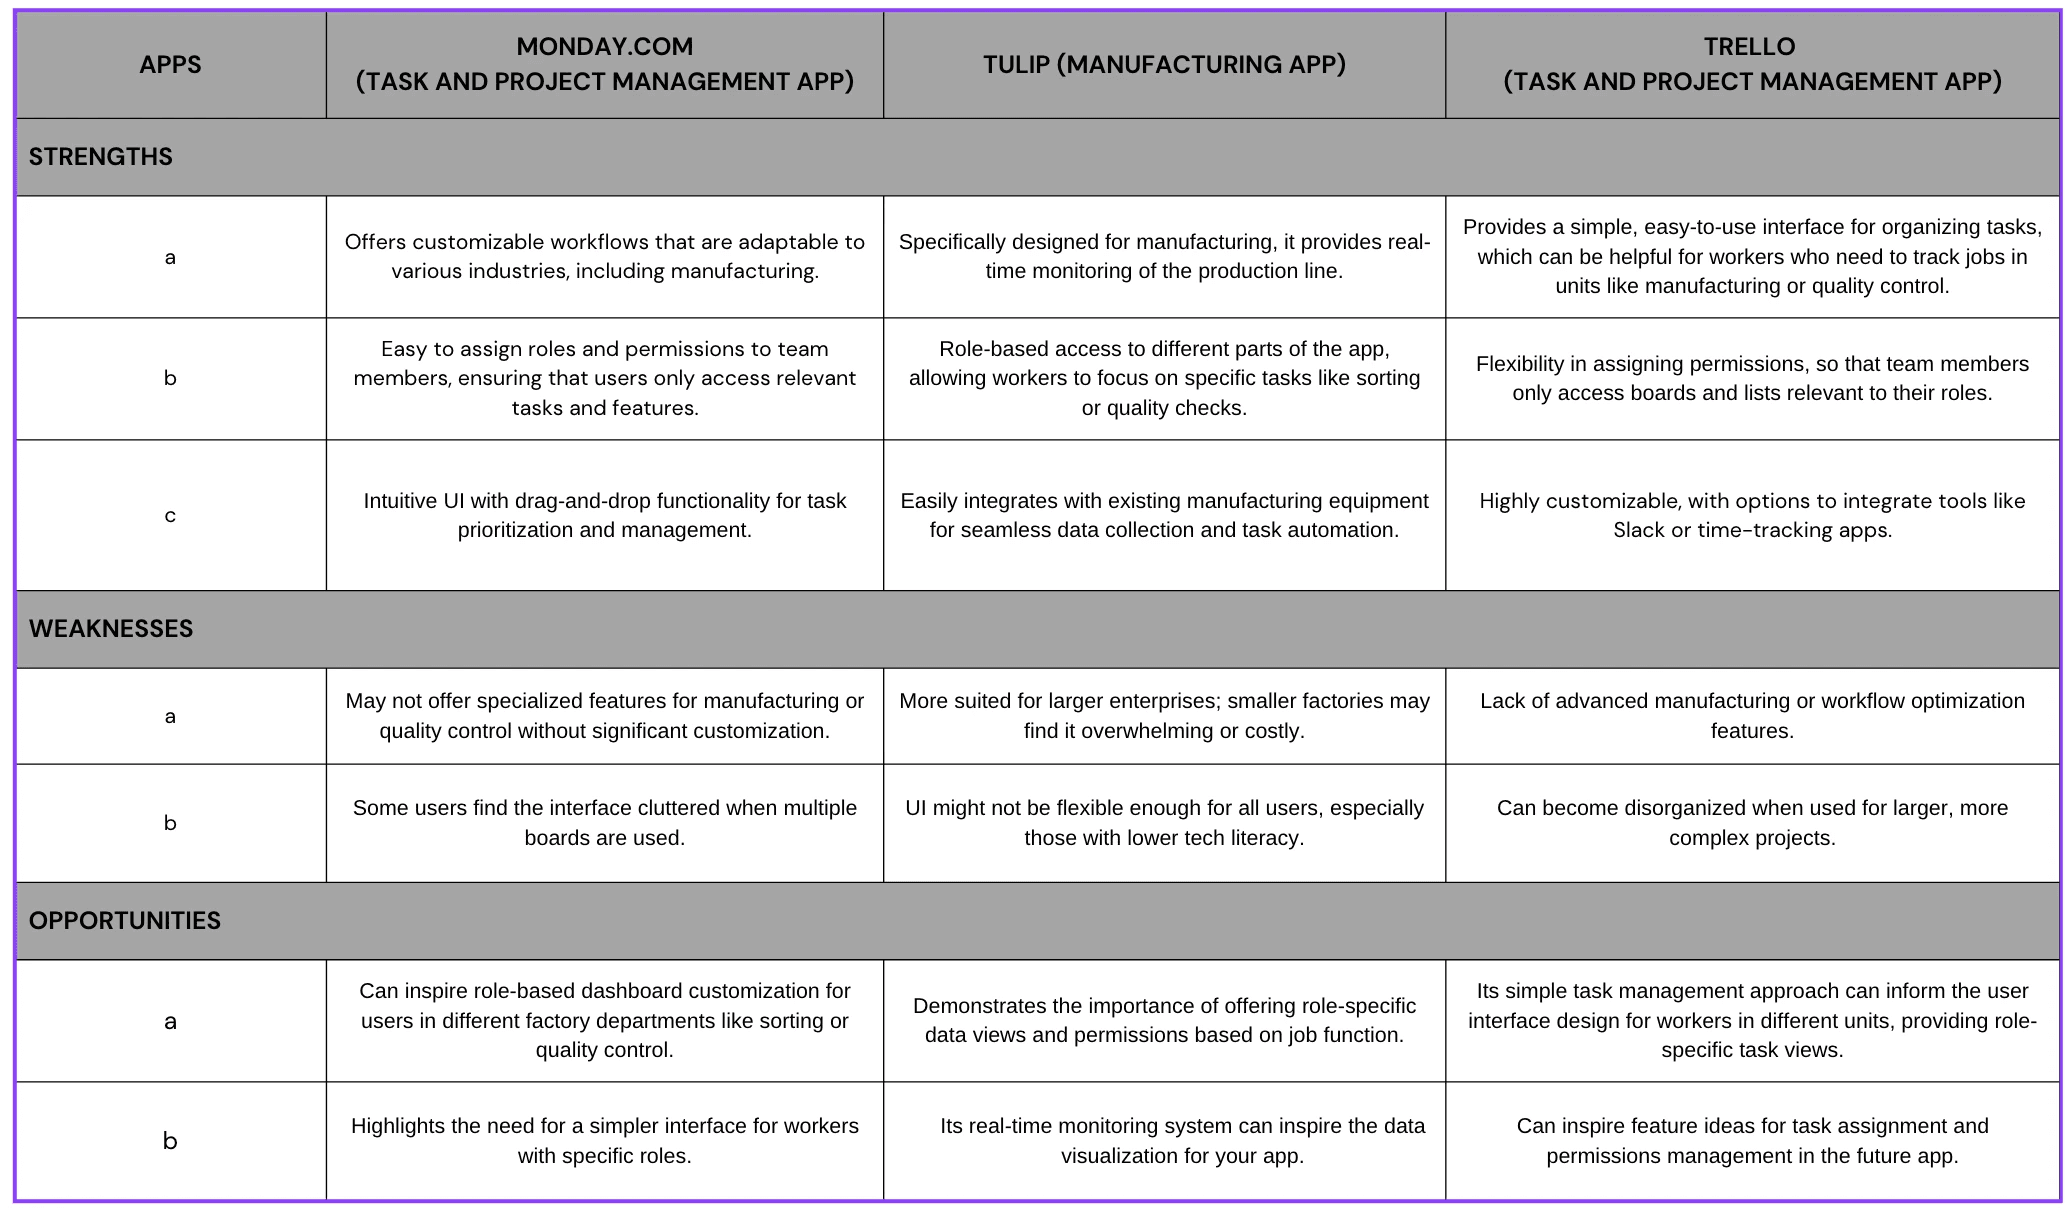
Outcome
Role-based access and permission management is crucial for ensuring that workers in different units (e.g., sorting, manufacturing, quality control) only access relevant features.
Customizable interfaces based on specific user roles and workflows can enhance efficiency, minimizing distraction from irrelevant tasks.
Real-time data and task monitoring features, similar to those in Tulip, are valuable for optimizing operations and improving workflow transparency.
#7 Research Findings

Outcome
Many workers experience frustration due to complex task management across units, which can be alleviated by implementing role-specific permissions and real-time monitoring.
Clear department assignment and division of labor, based on user eligibility, will increase productivity and engagement within the app.
The app needs to support streamlined role-based access to ensure workers only have control over relevant tasks in their assigned units.
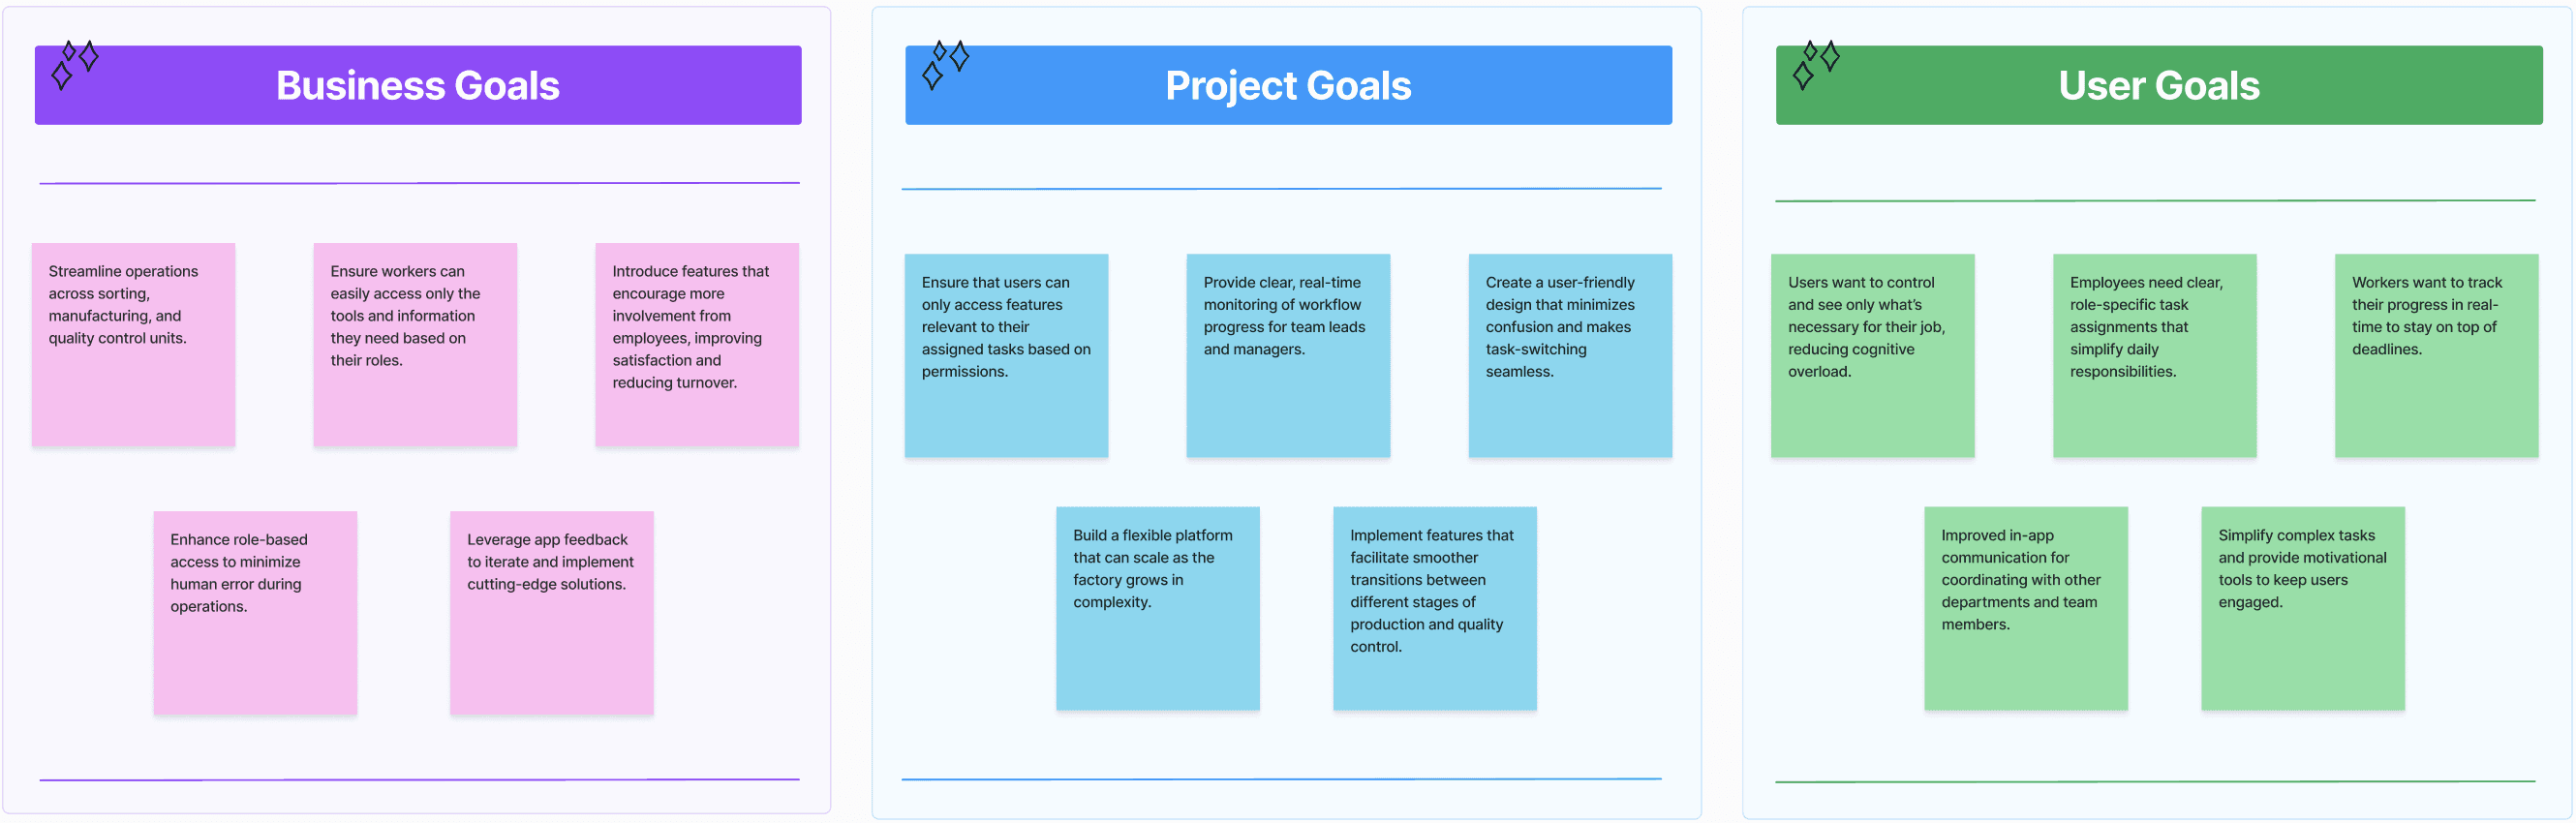
UX Design Goals
The main goals of the UX Smart Factory app: to create an intuitive, user-centered interface that simplifies task management and enhances productivity. The design should minimize complexity, offer personalized solutions, and support seamless user experiences across all operational roles in the smart factory.
UX Design and Implementations
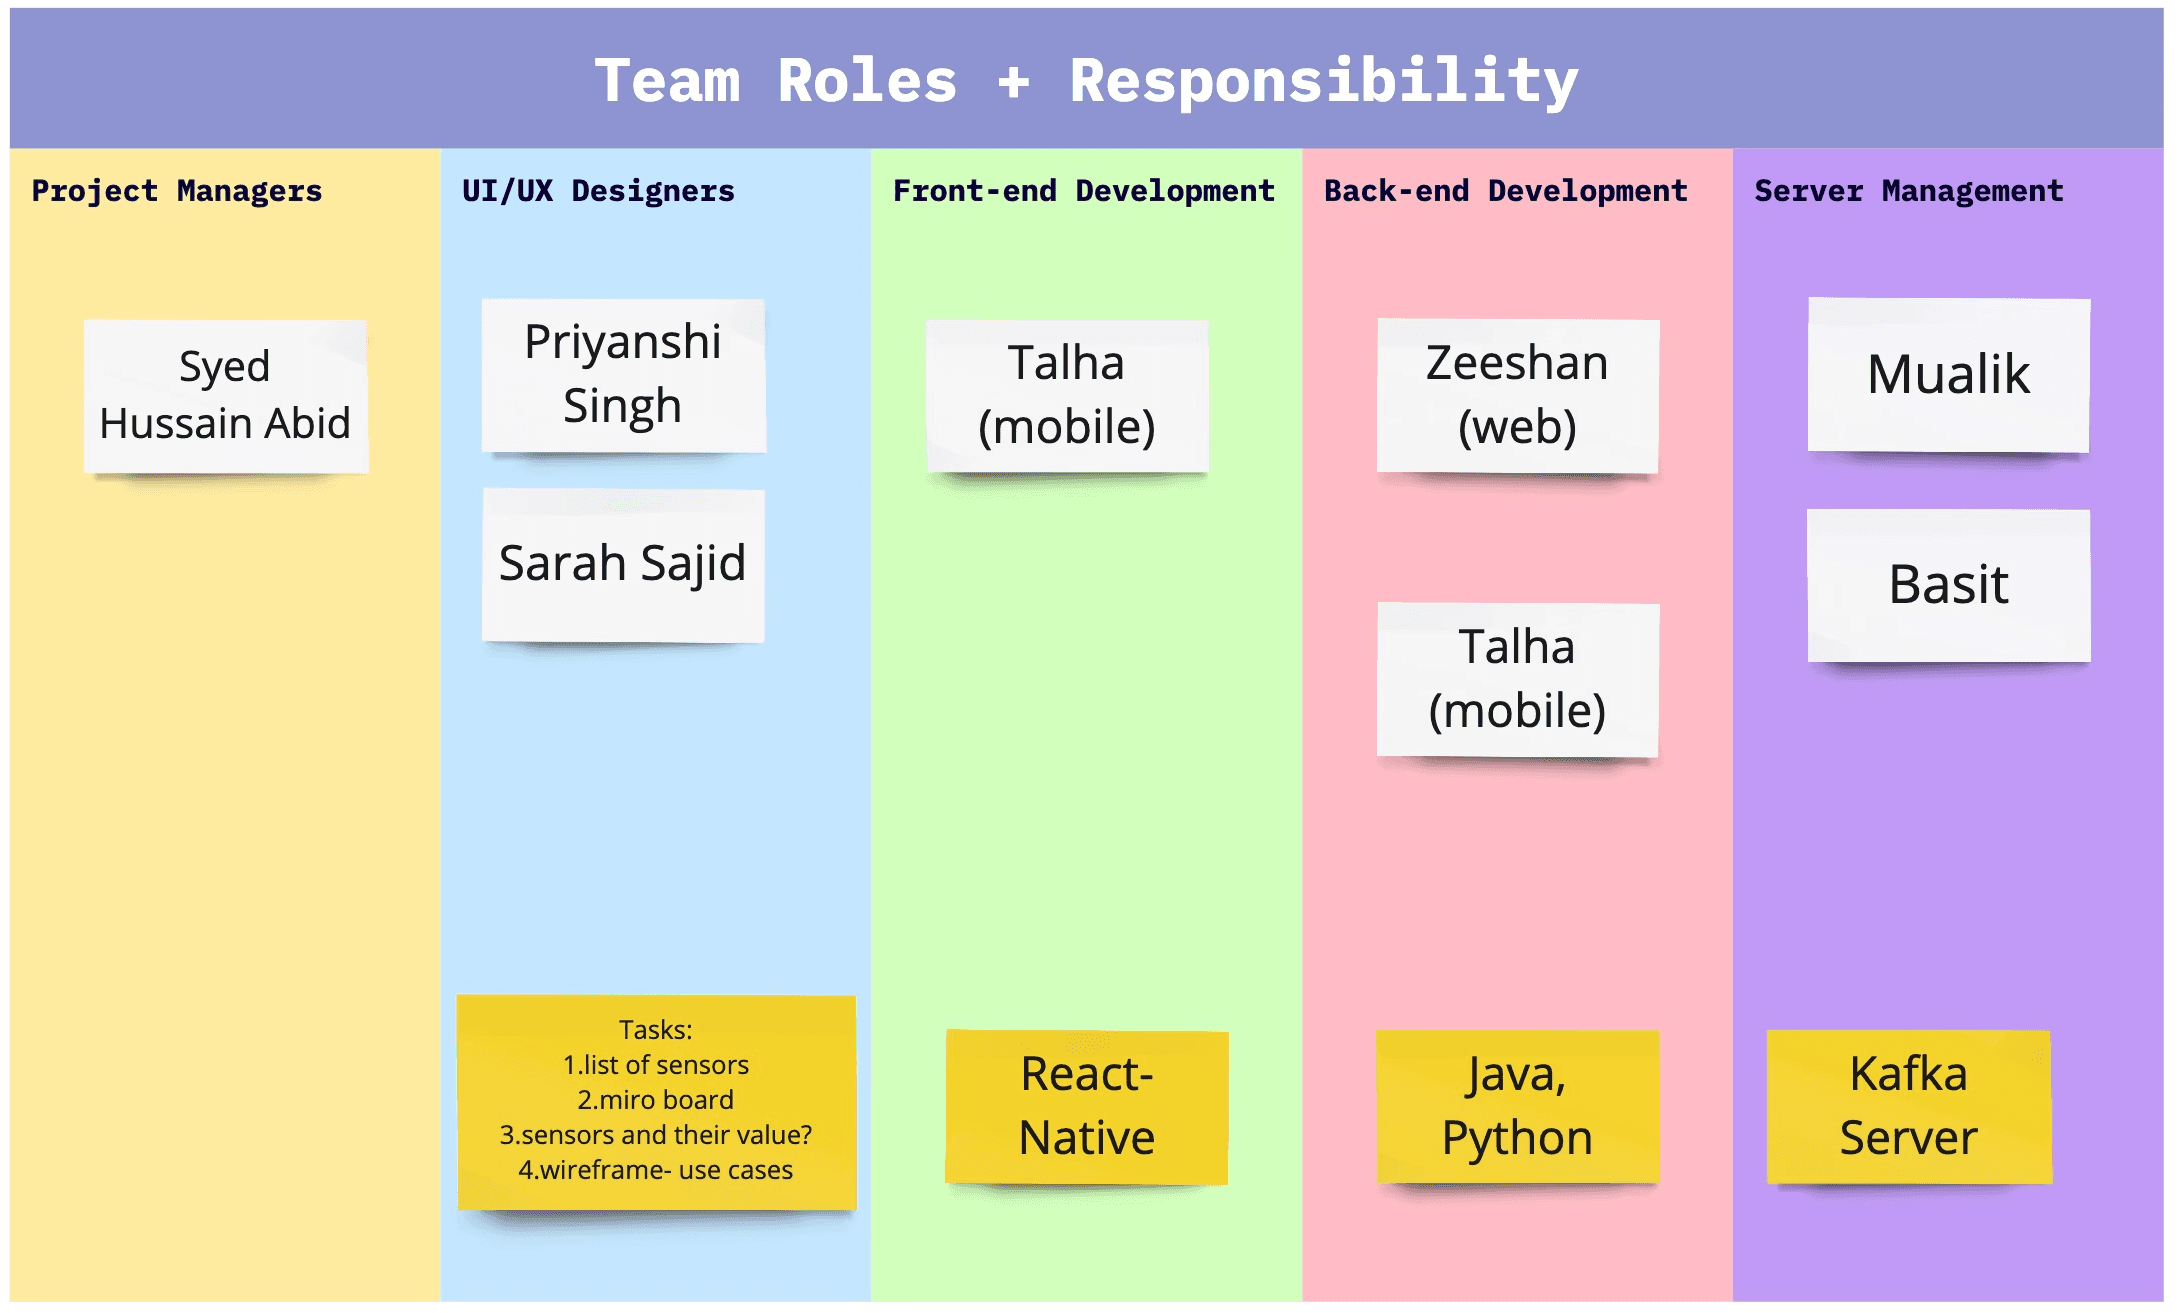
Collaborative Team Dynamics
The below visualization highlights the collaborative nature of the current project, showcasing the diverse teams involved and their respective responsibilities. This collaborative framework was key to achieving project success through cohesive teamwork and aligned responsibilities.
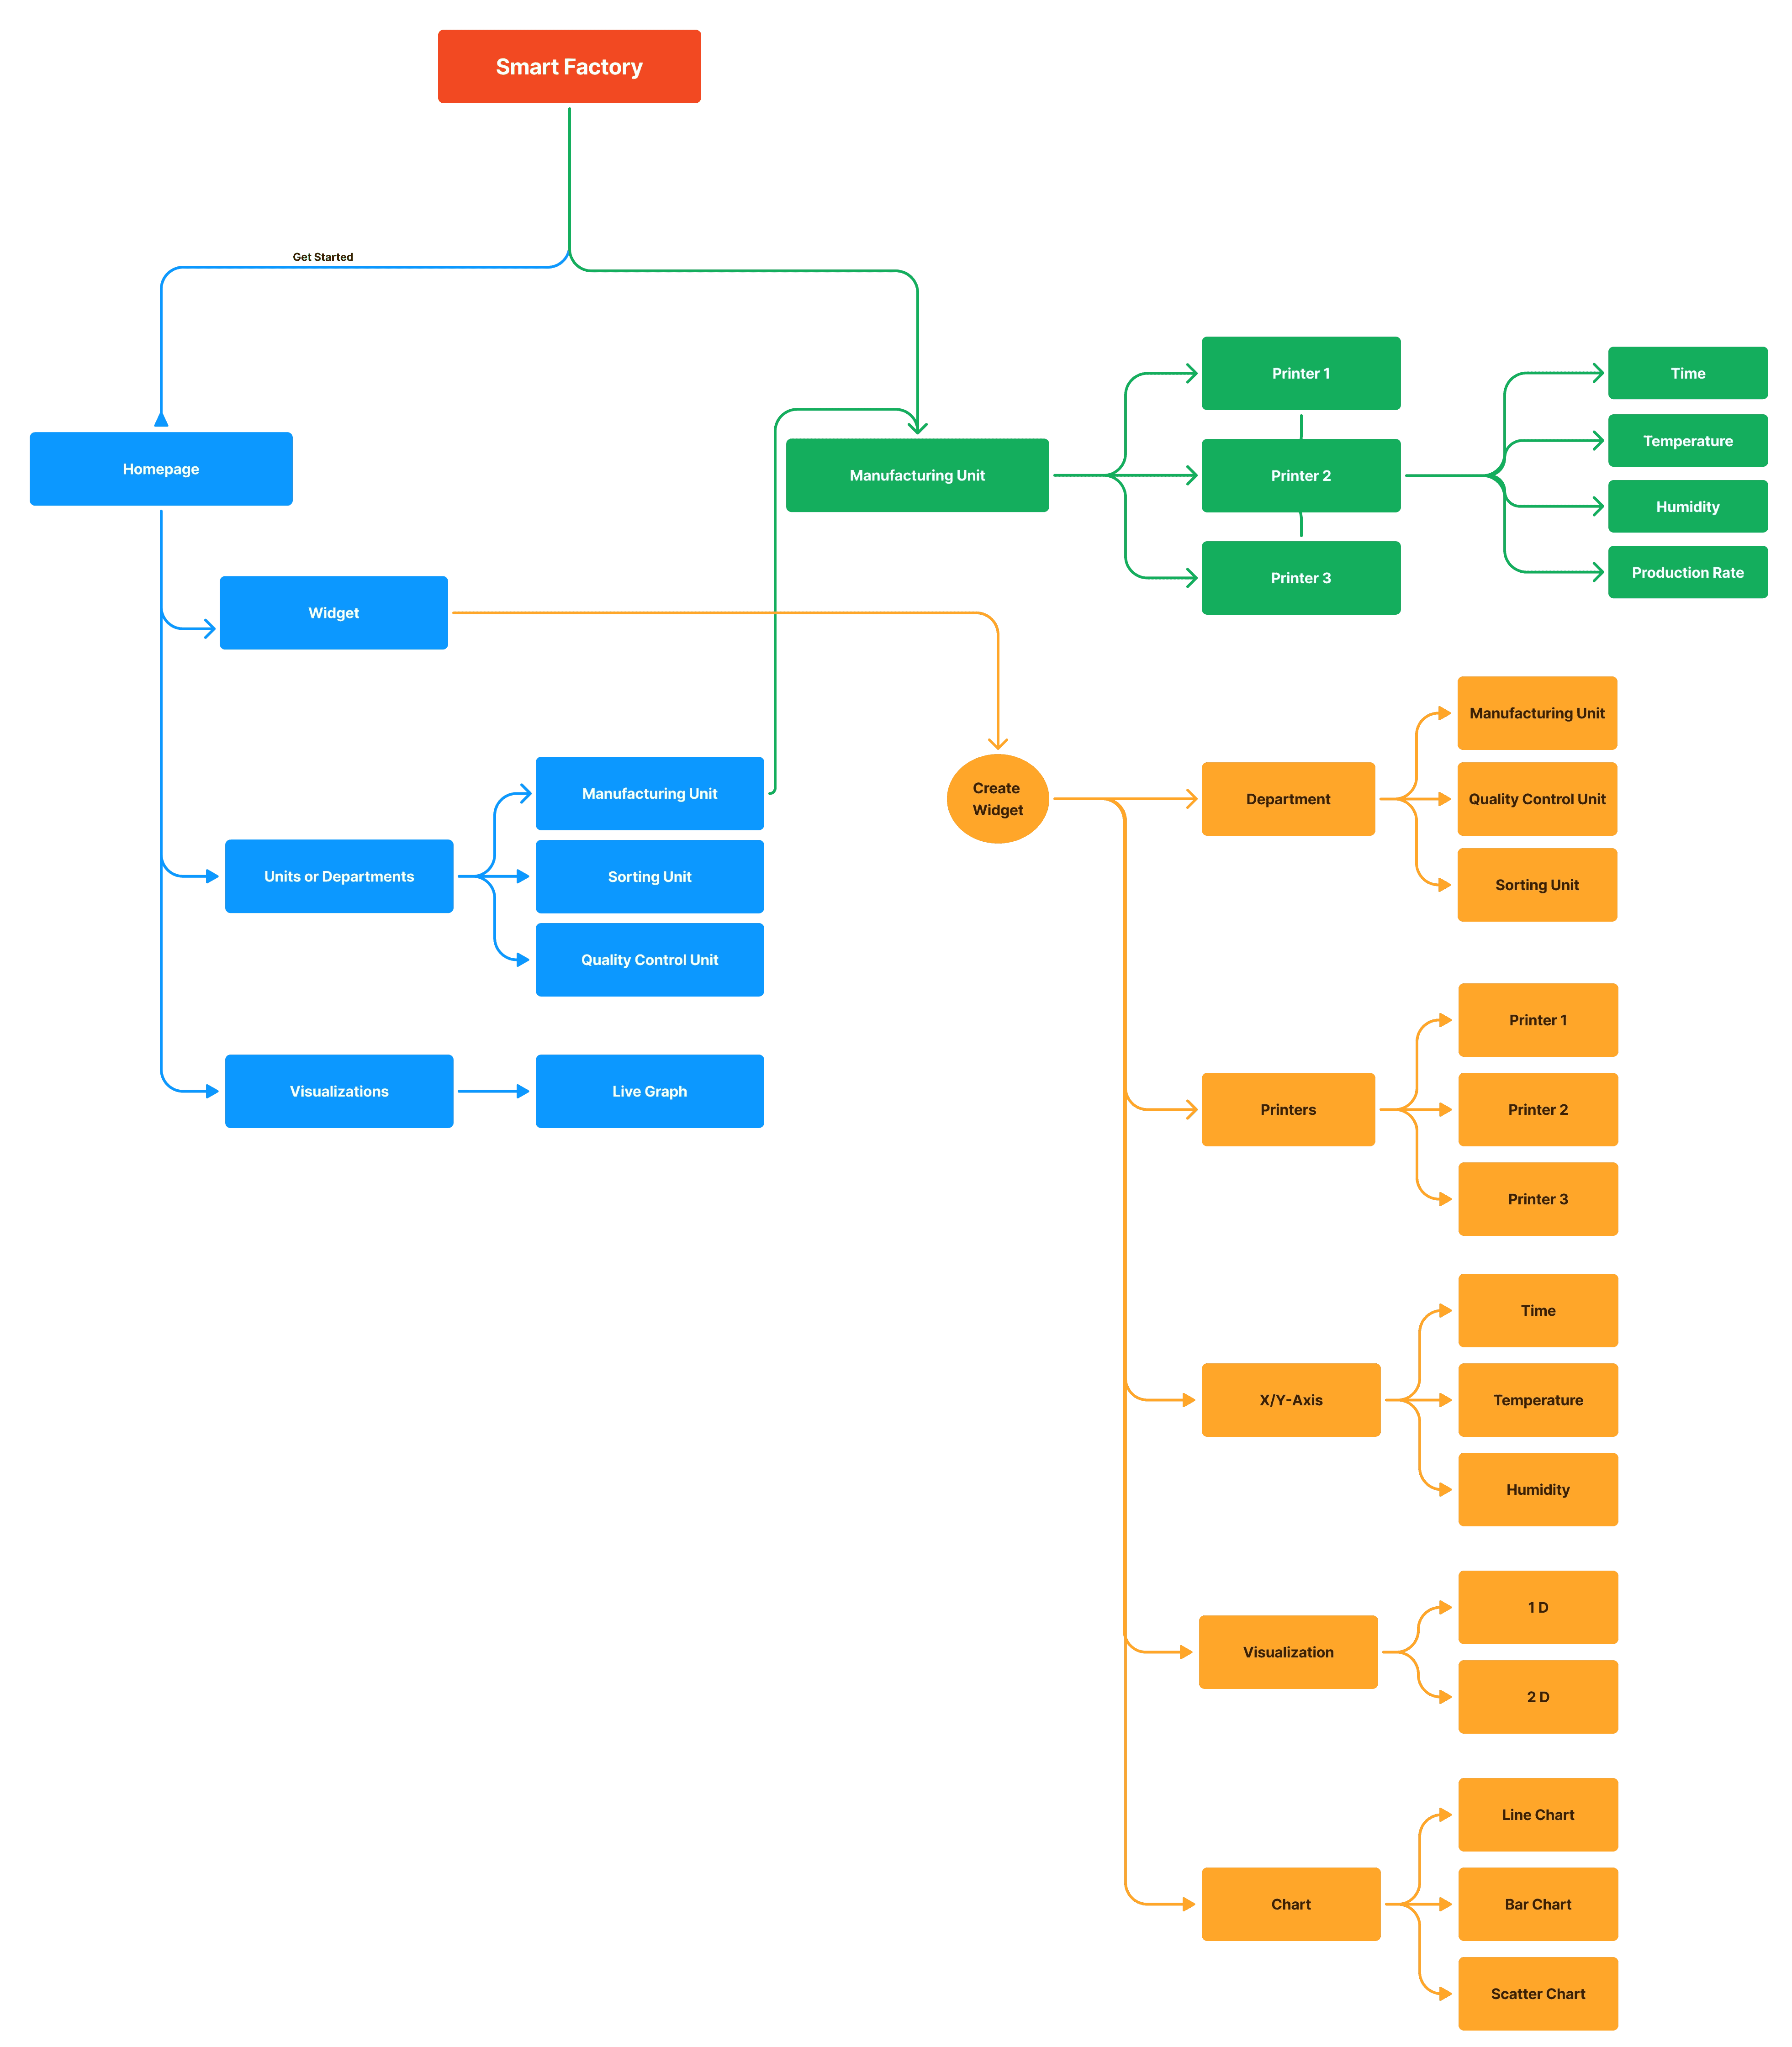
UX Information Architecture
The Information Architecture is designed to create a user-friendly experience for all stakeholders in the smart factory project. By clearly organizing information and functionality, users can navigate the app efficiently and effectively, supporting their specific roles and responsibilities.
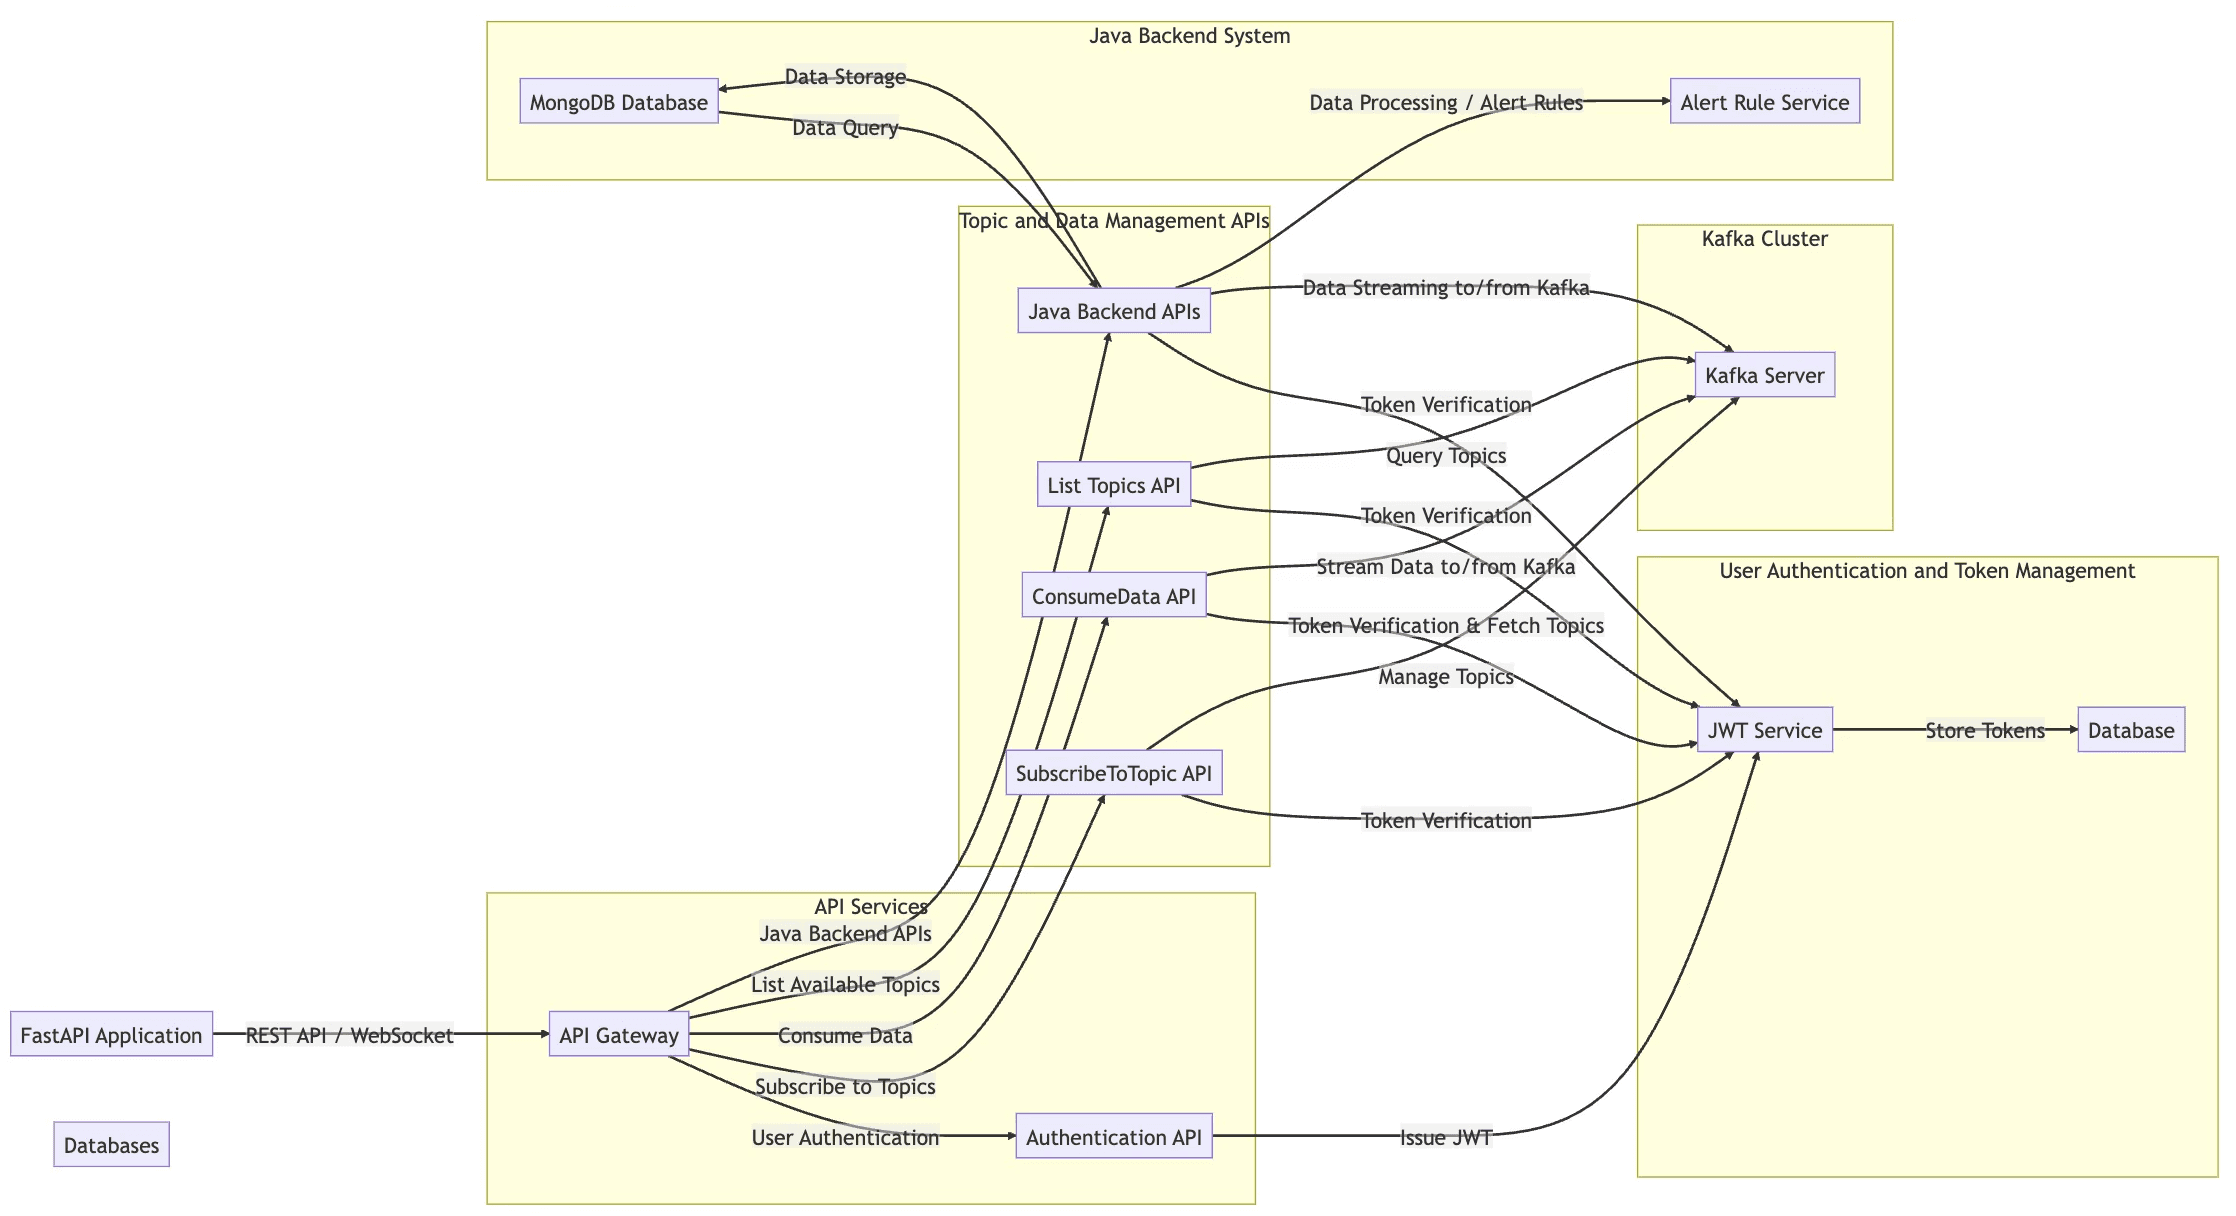
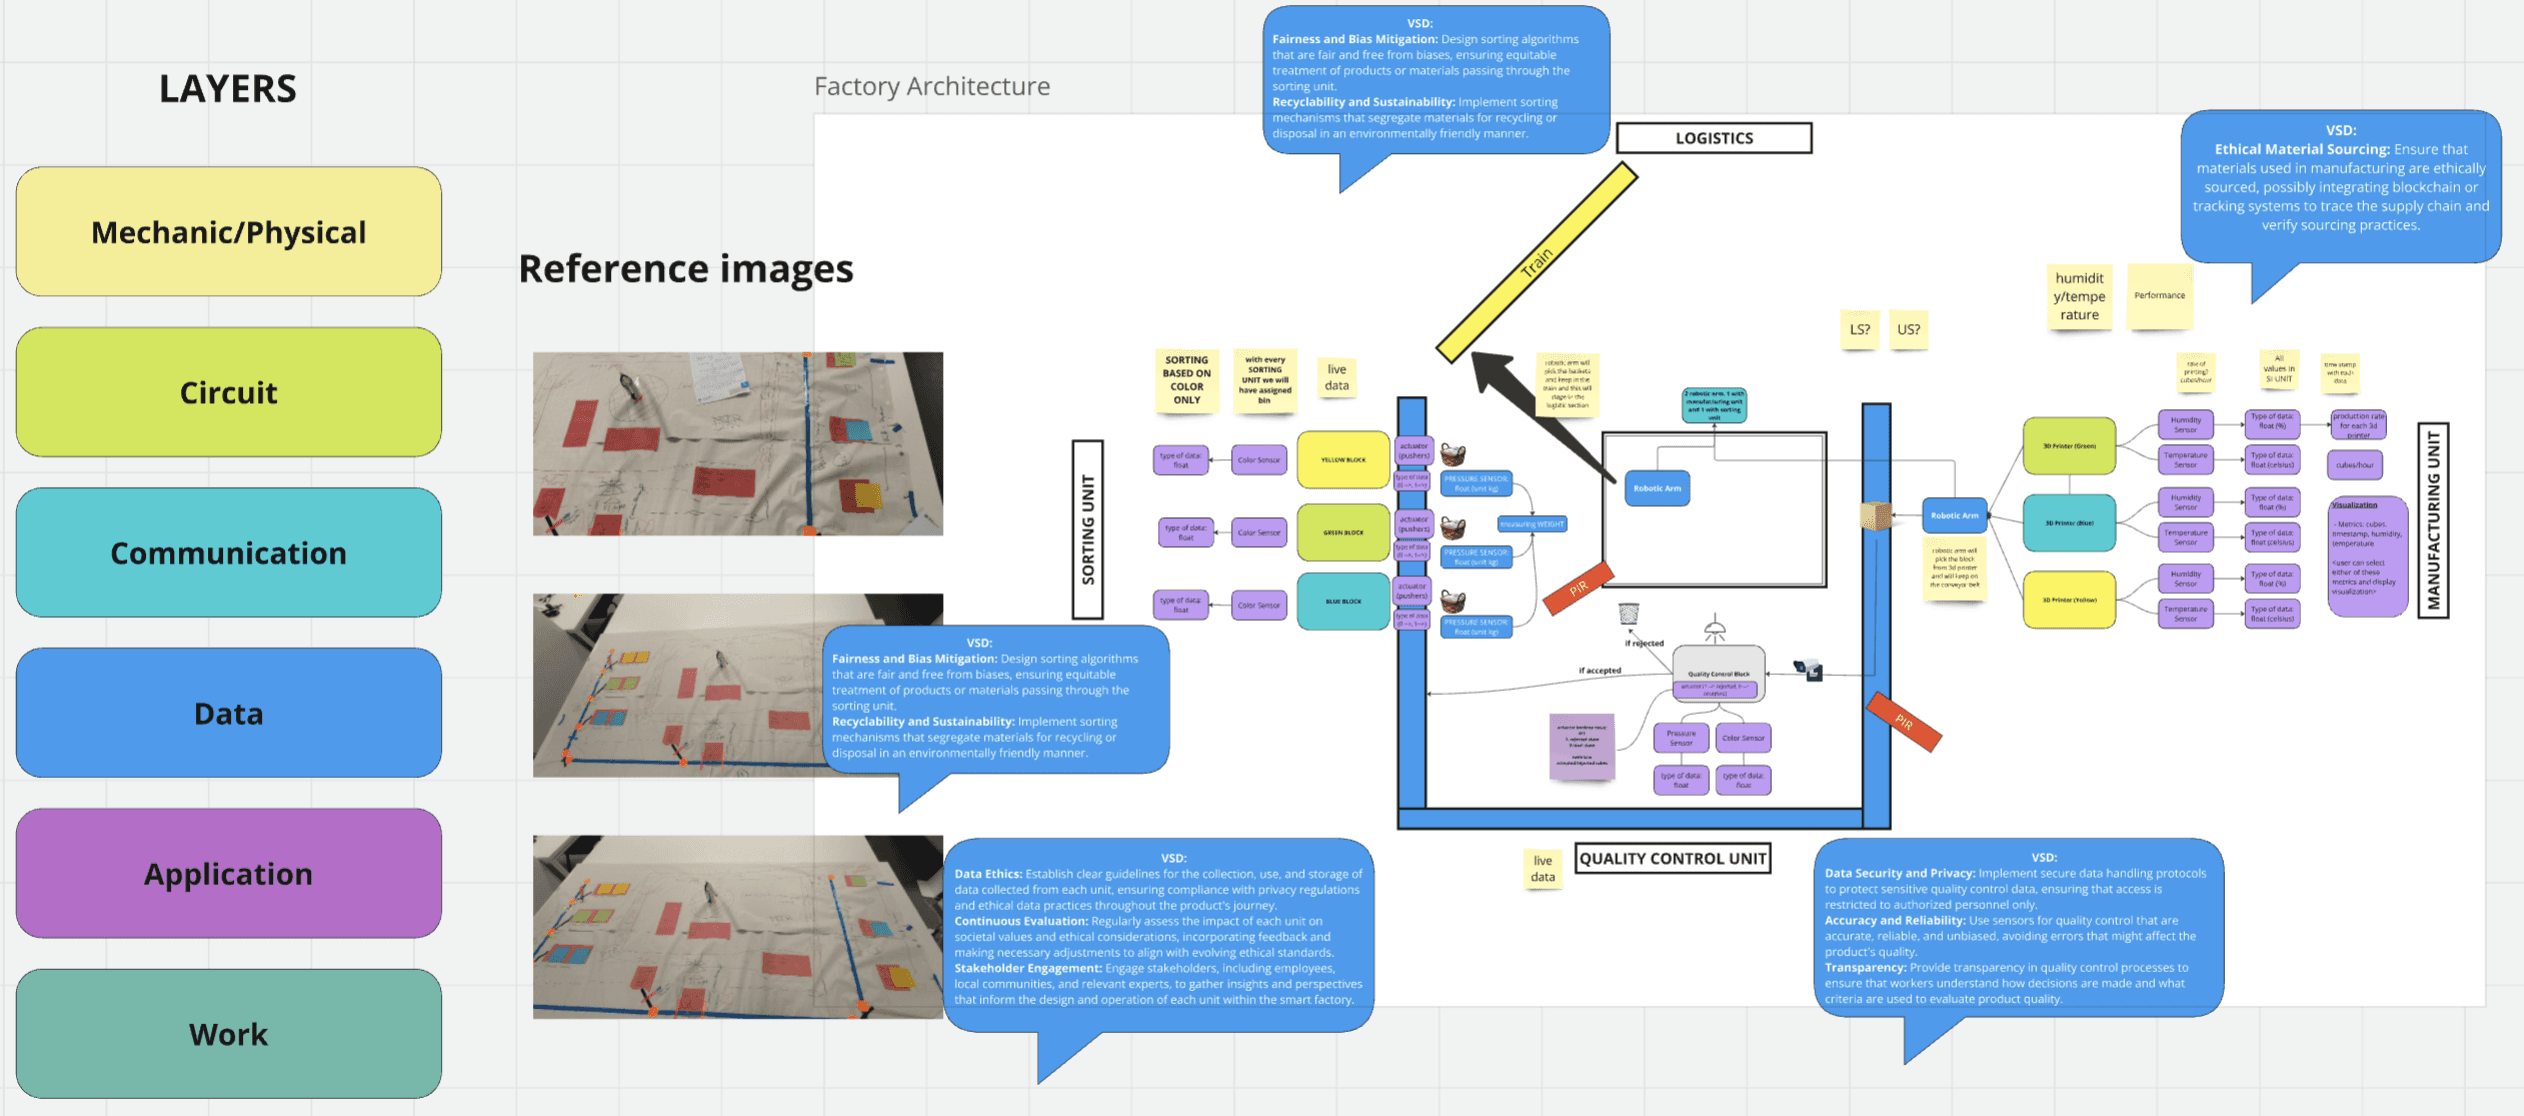
Backend Architecture Overview
This section outlines the backend architecture of the project, detailing how various components interact to support the app's functionality. The backend was developed collaboratively by frontend and backend developers, with my role as a UX designer focusing on ensuring a seamless user experience through effective communication and collaboration. This architecture supports the app’s features by optimizing data flow and enhancing performance, thus improving overall user satisfaction.

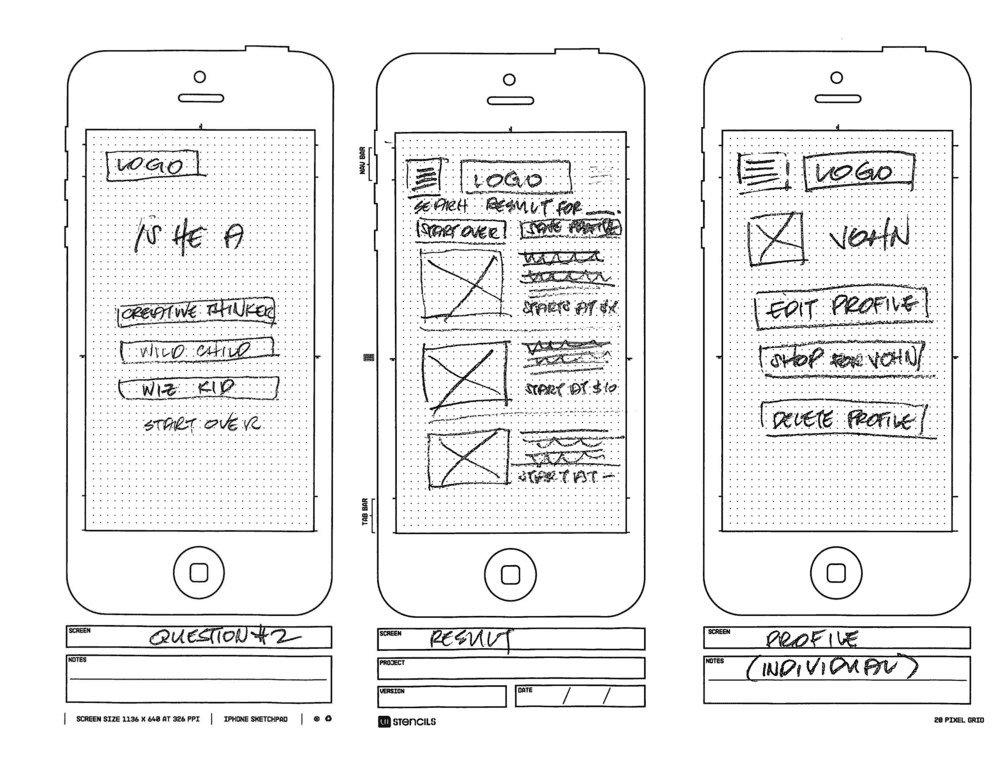
Planning: Rough Sketches and Initial Concepts
In this section, I share the preliminary sketches and brainstorming notes from the early planning phase of the project.
Using Miro as a collaborative space, I mapped out key screens such as the login page and dashboard, envisioning the overall structure and flow of the app. These rough sketches provided a foundation for identifying essential features and aligning with user goals before progressing to detailed designs.
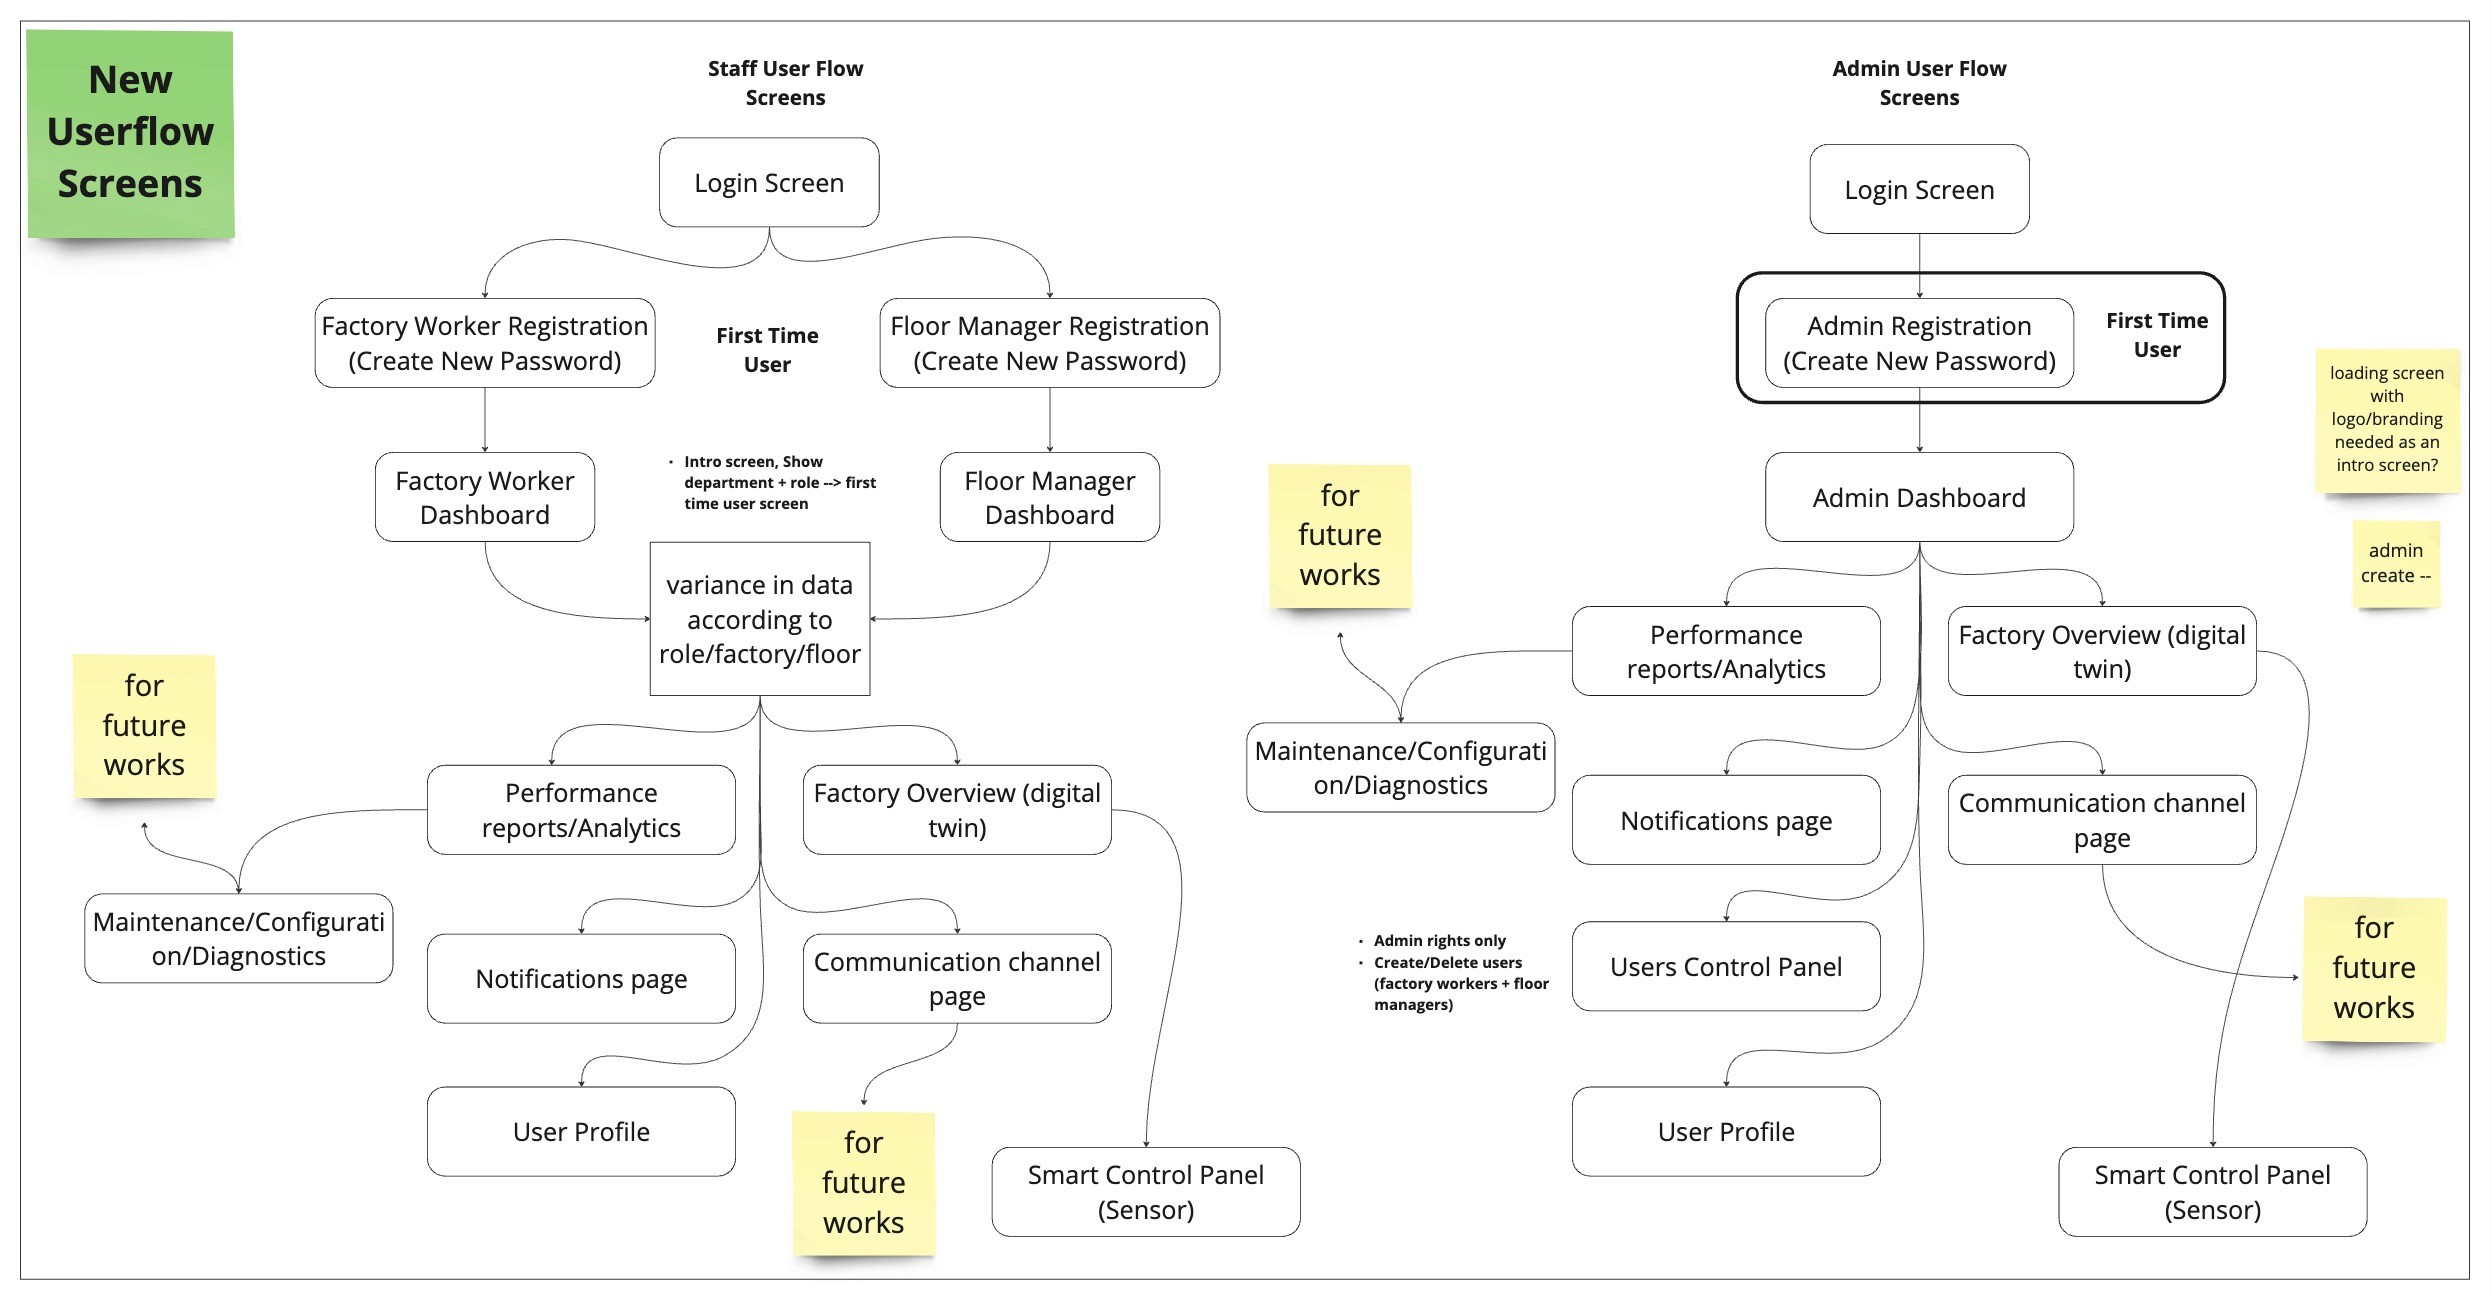
User Flow: Visualizing User Journey of a Pilot User and Admin
A clear and logical information architecture was developed to ensure easy navigation and quick access to key features, enabling users to efficiently manage tasks and receive timely reminders.

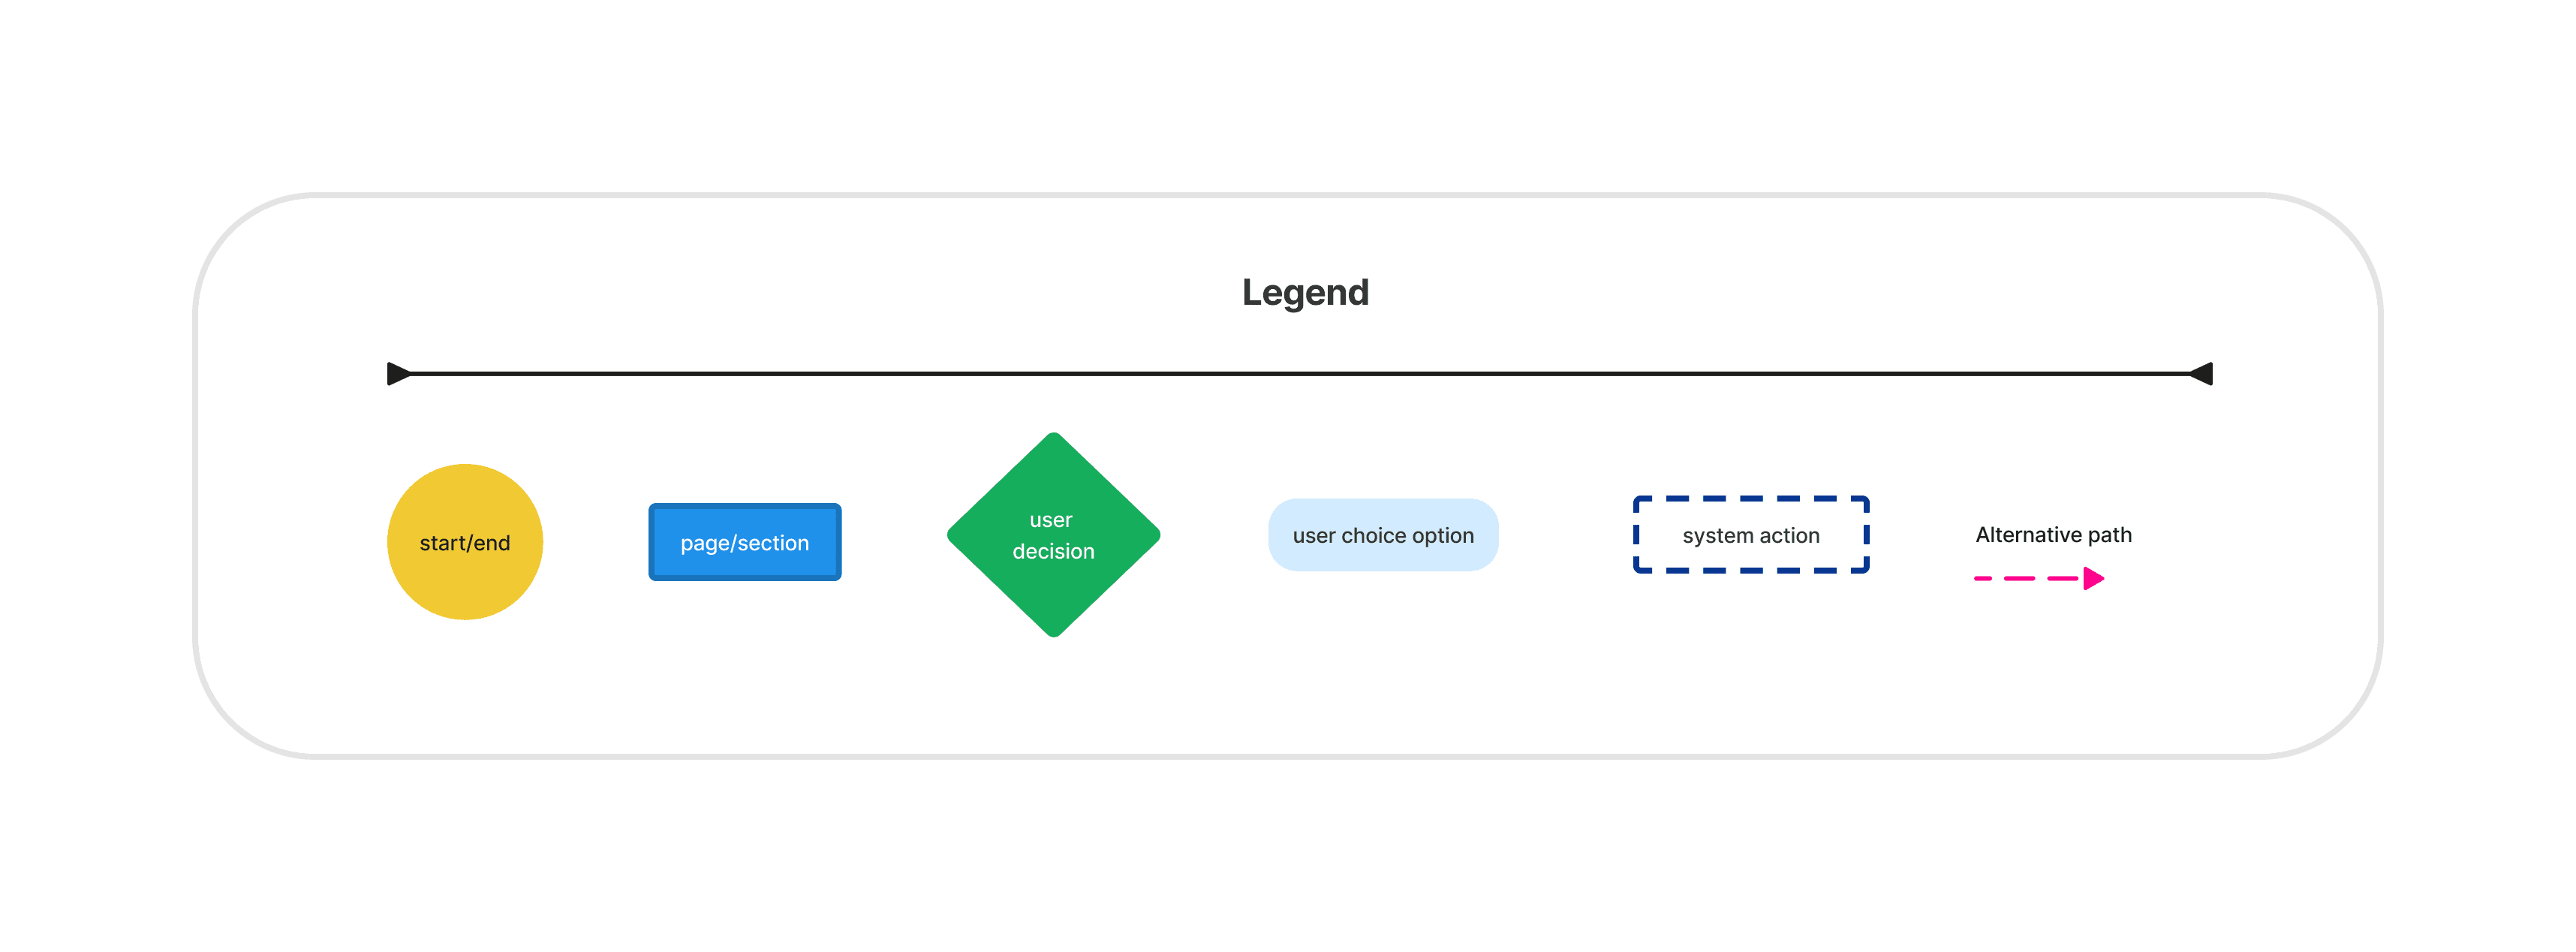
User Flows
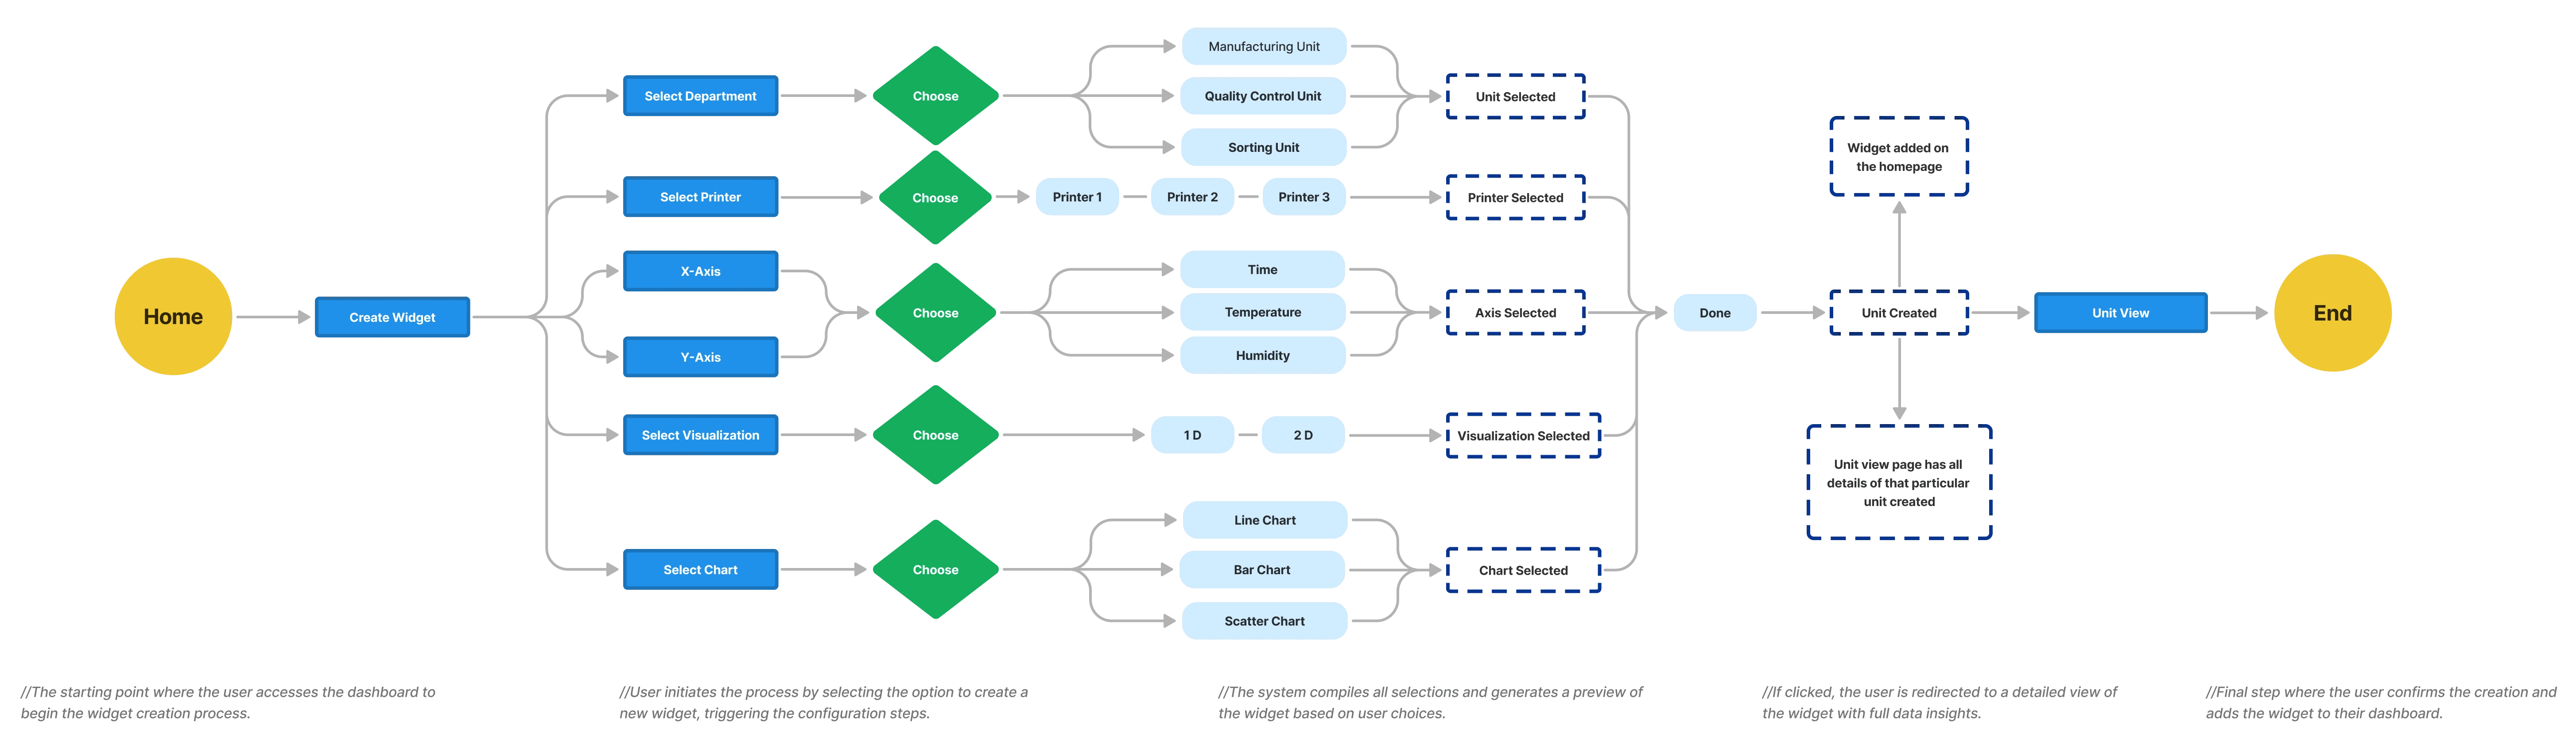
A user flow outlines the specific path a user takes to complete a task or achieve a goal within an application. It visually represents each step of the process, including decisions and interactions, ensuring the user experience is smooth and intuitive.
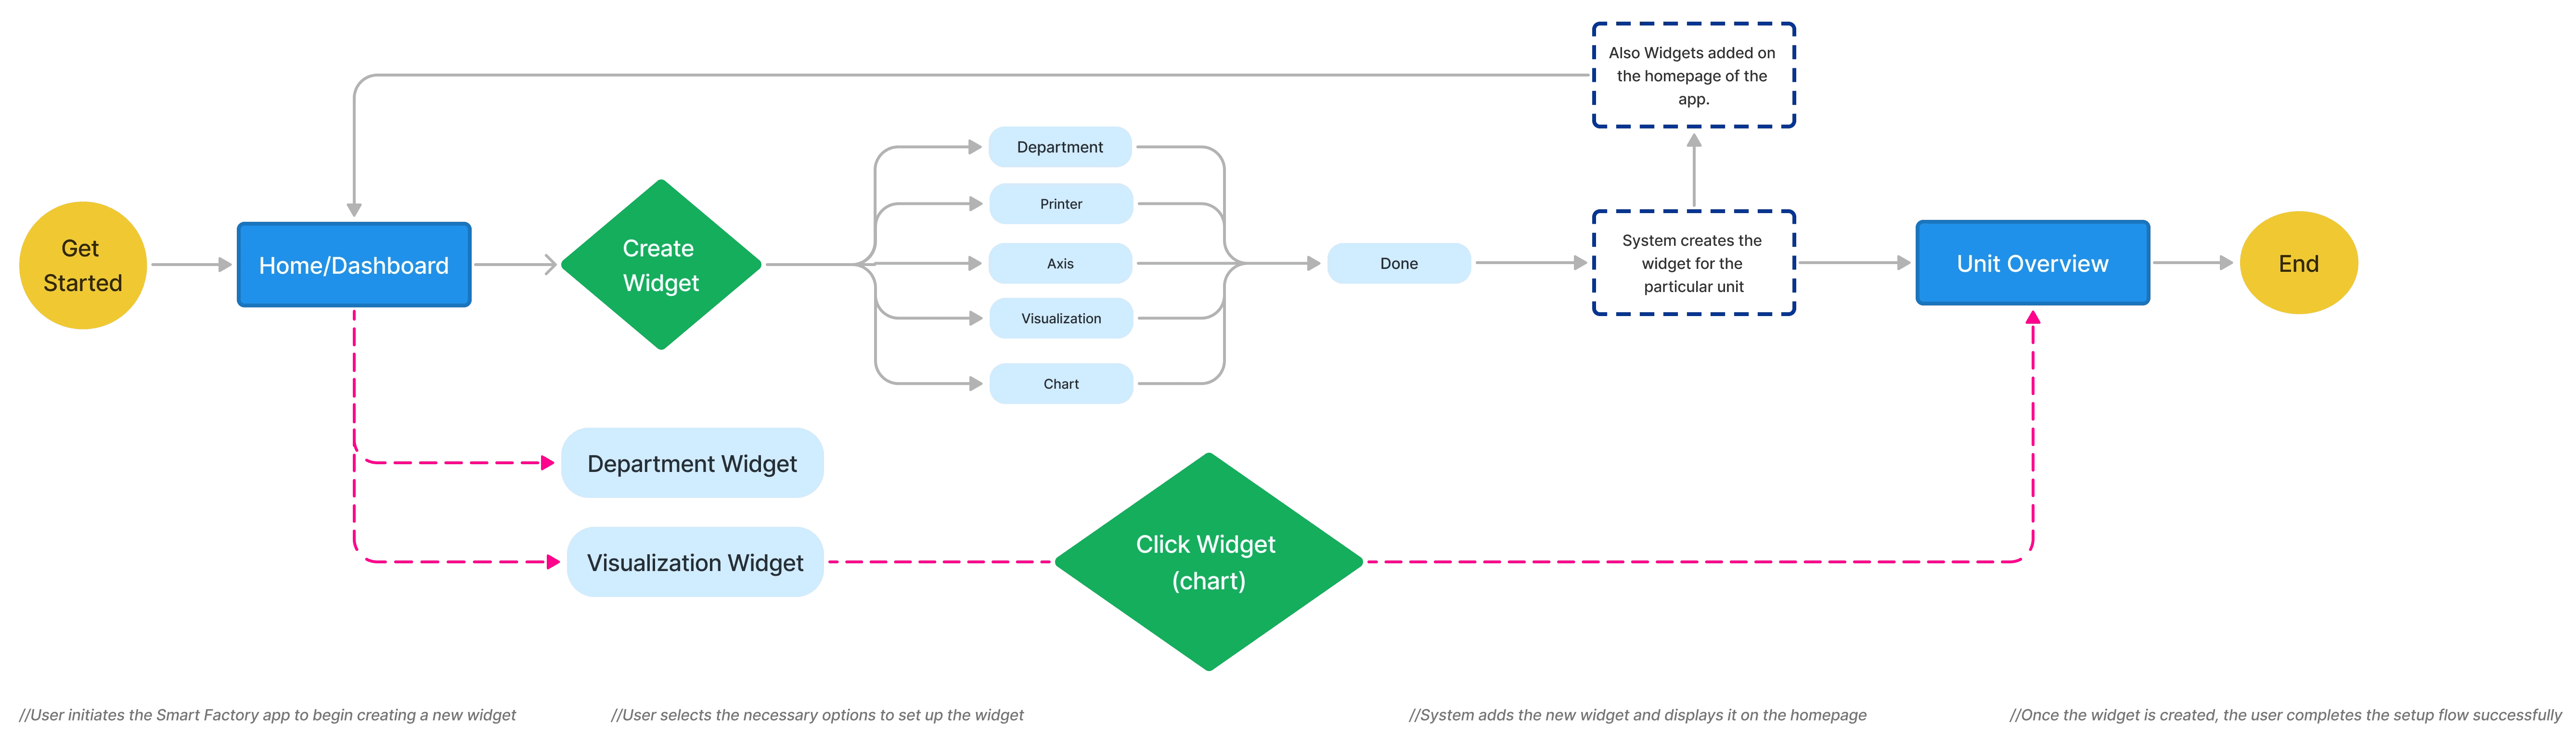
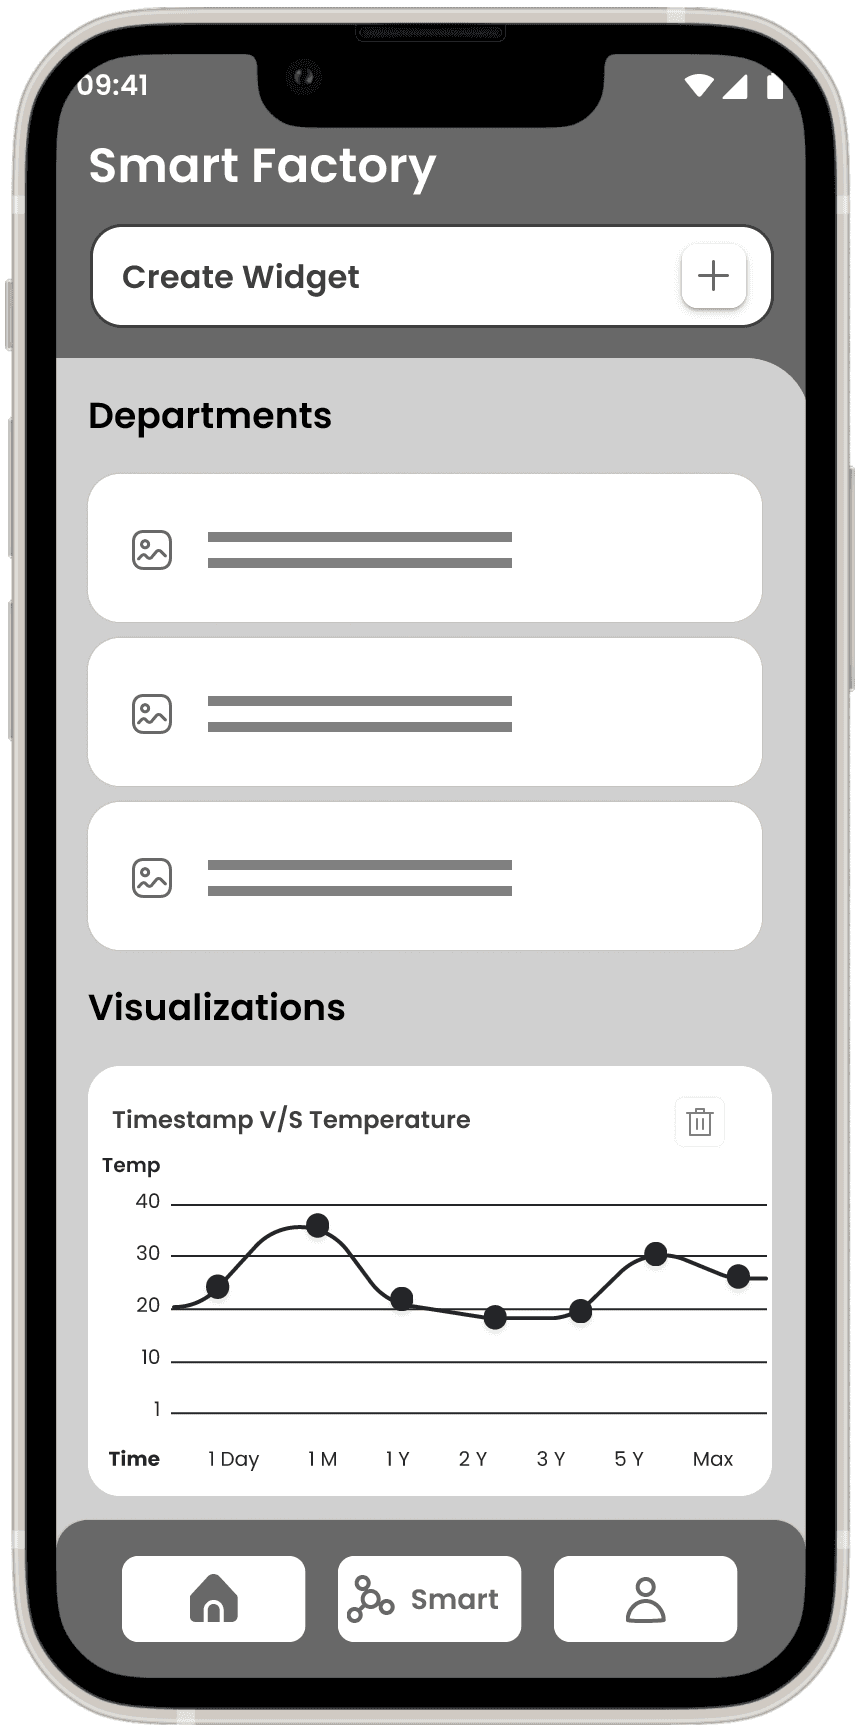
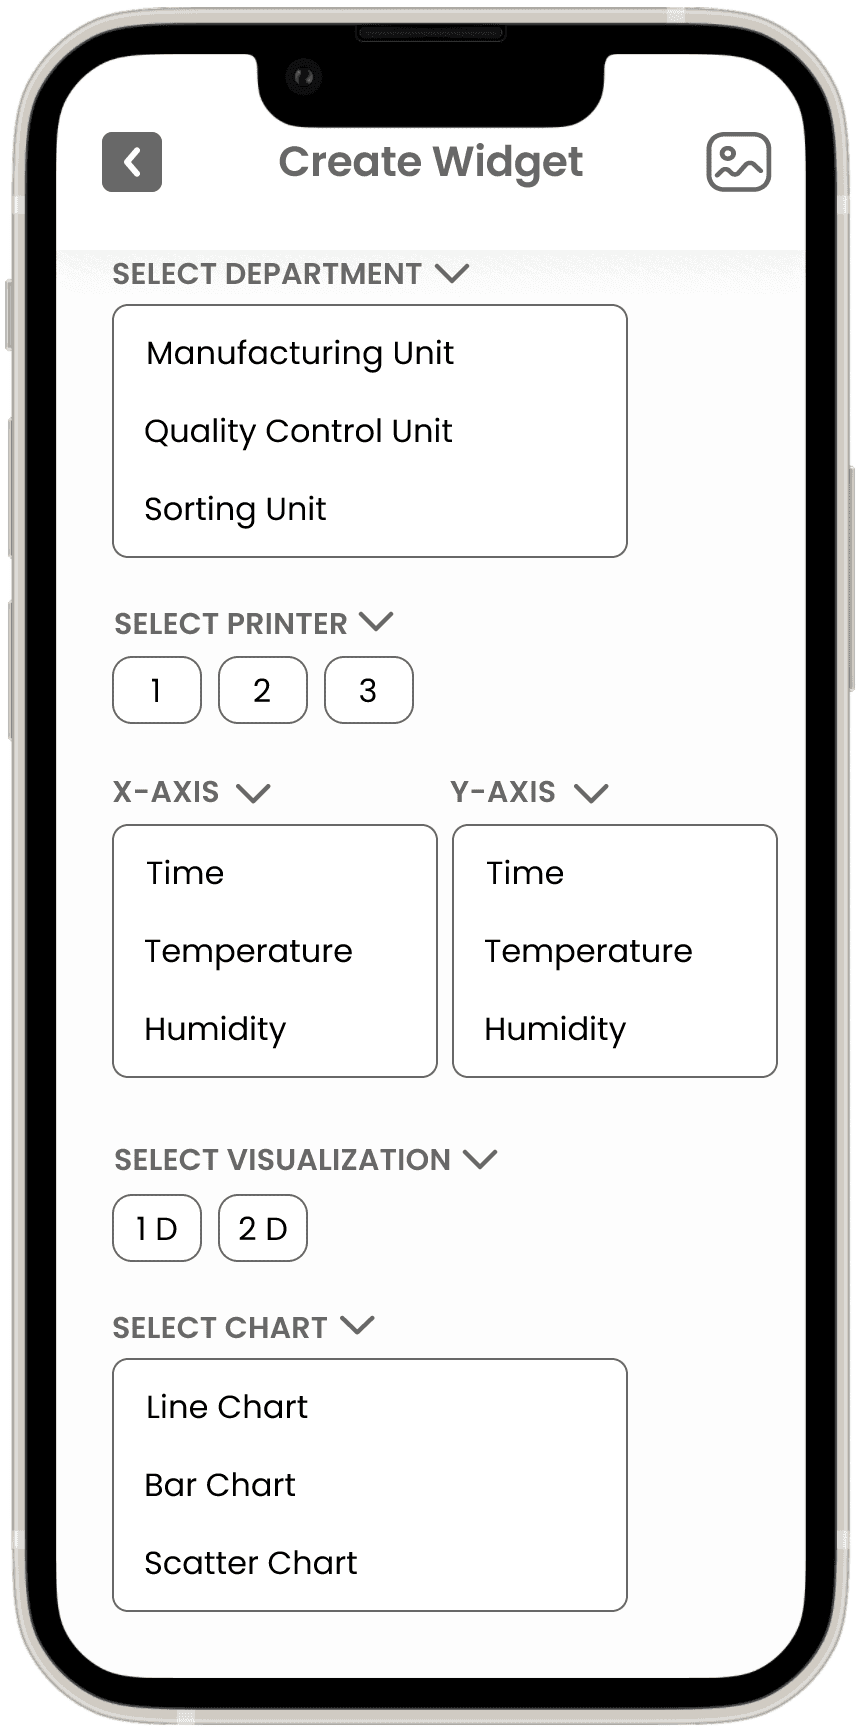
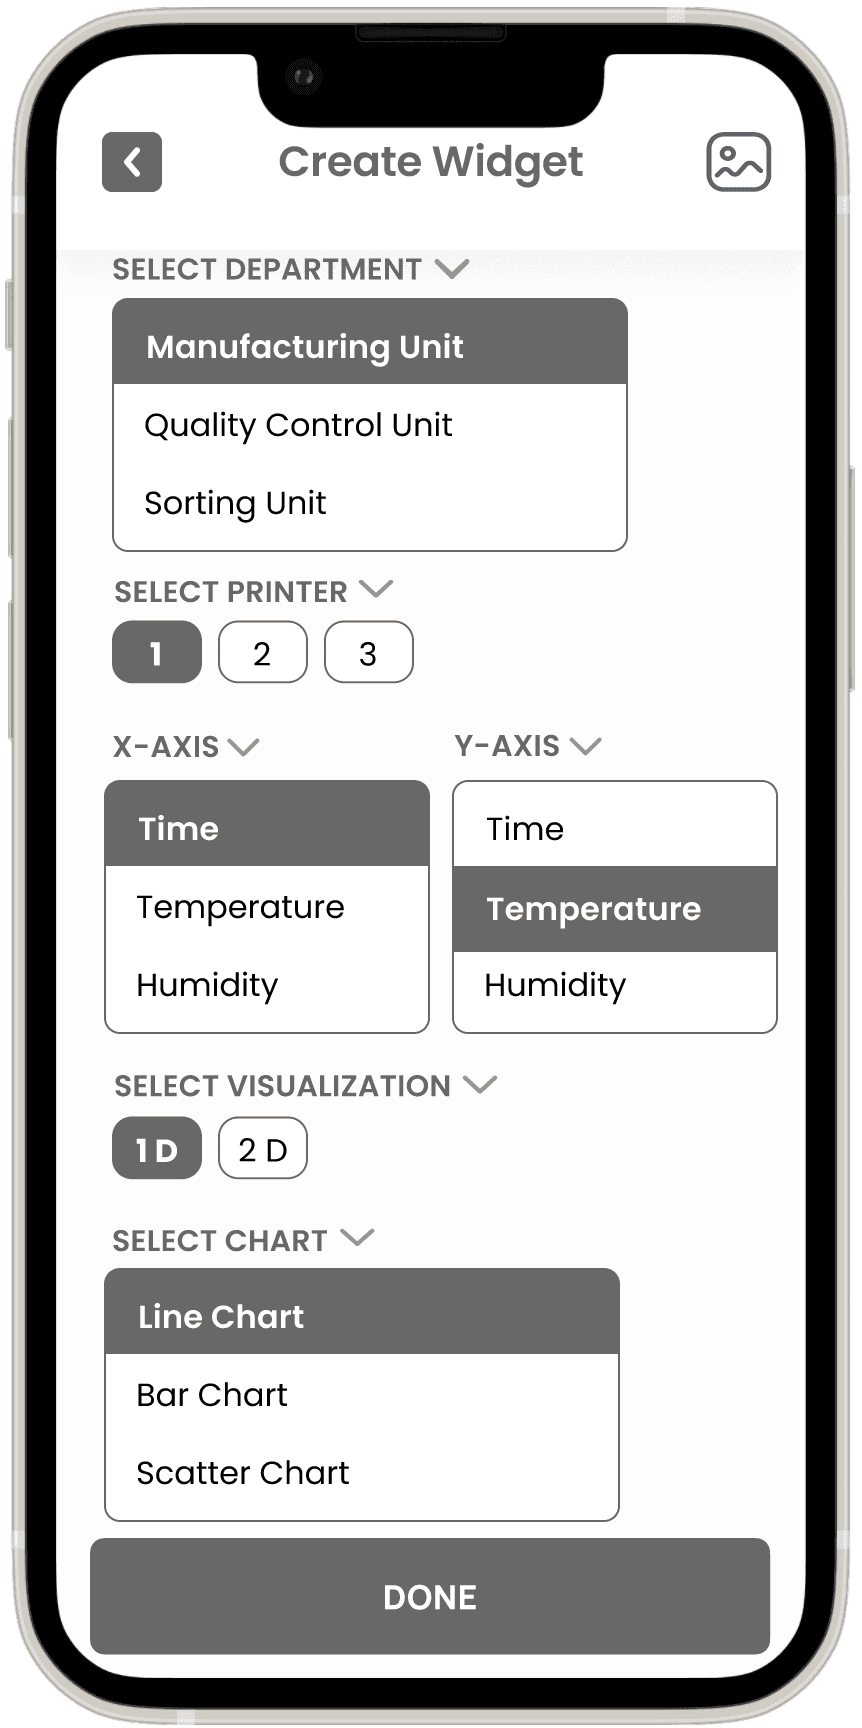
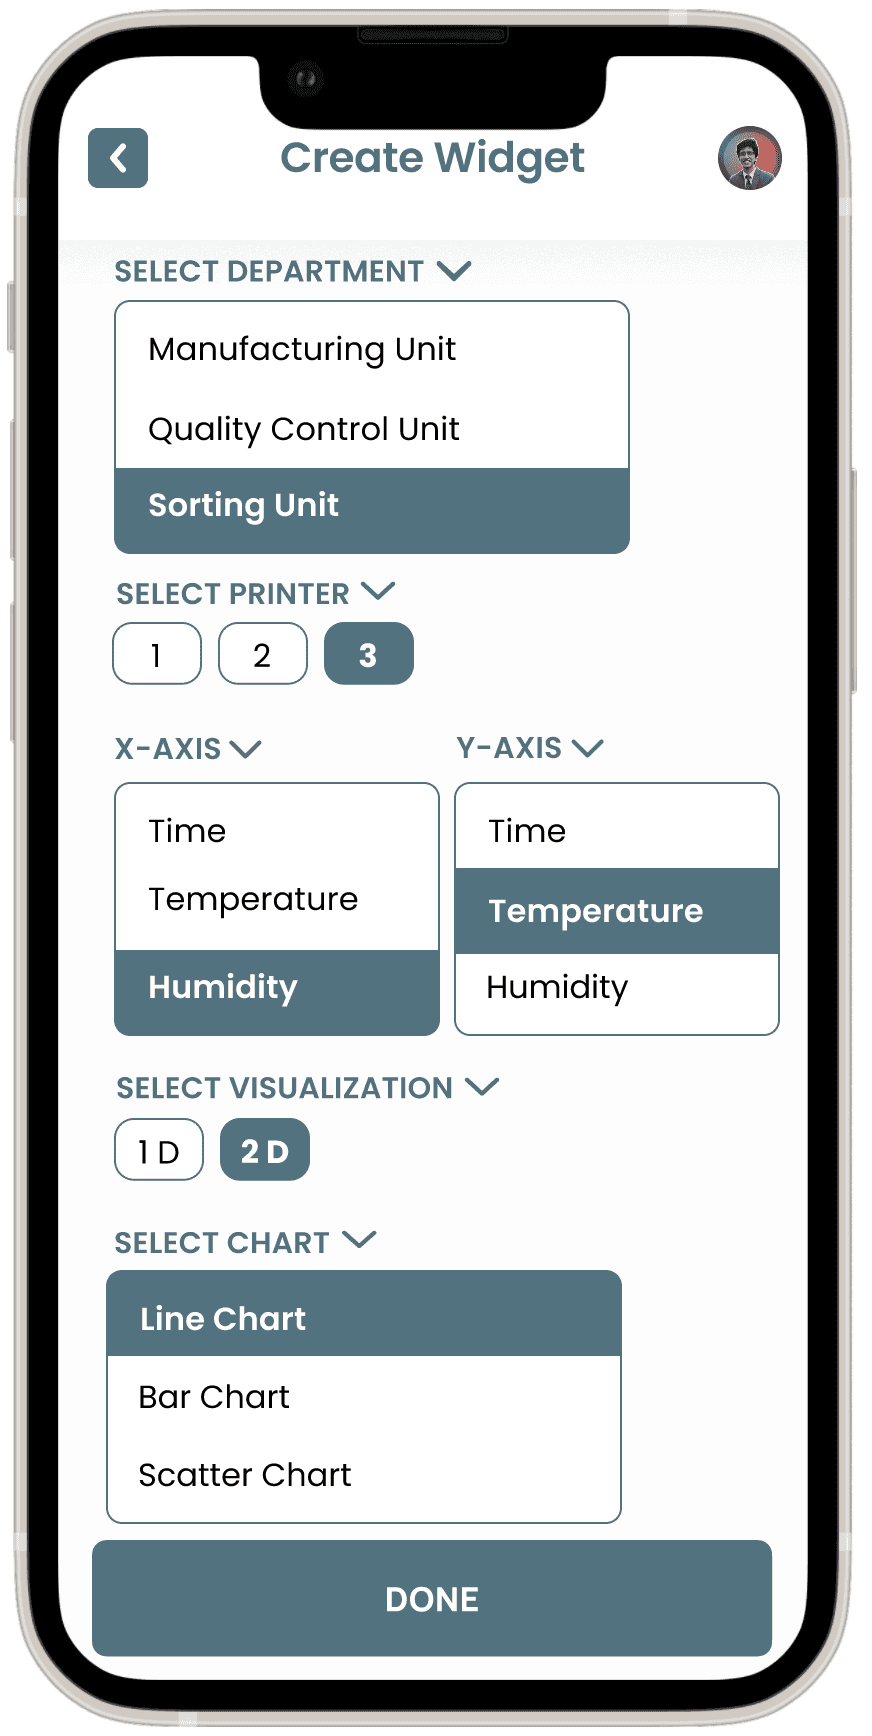
User Flow 1: Widget Setup Process
Objective: Guide the user through the process of creating and configuring a widget for monitoring factory data.
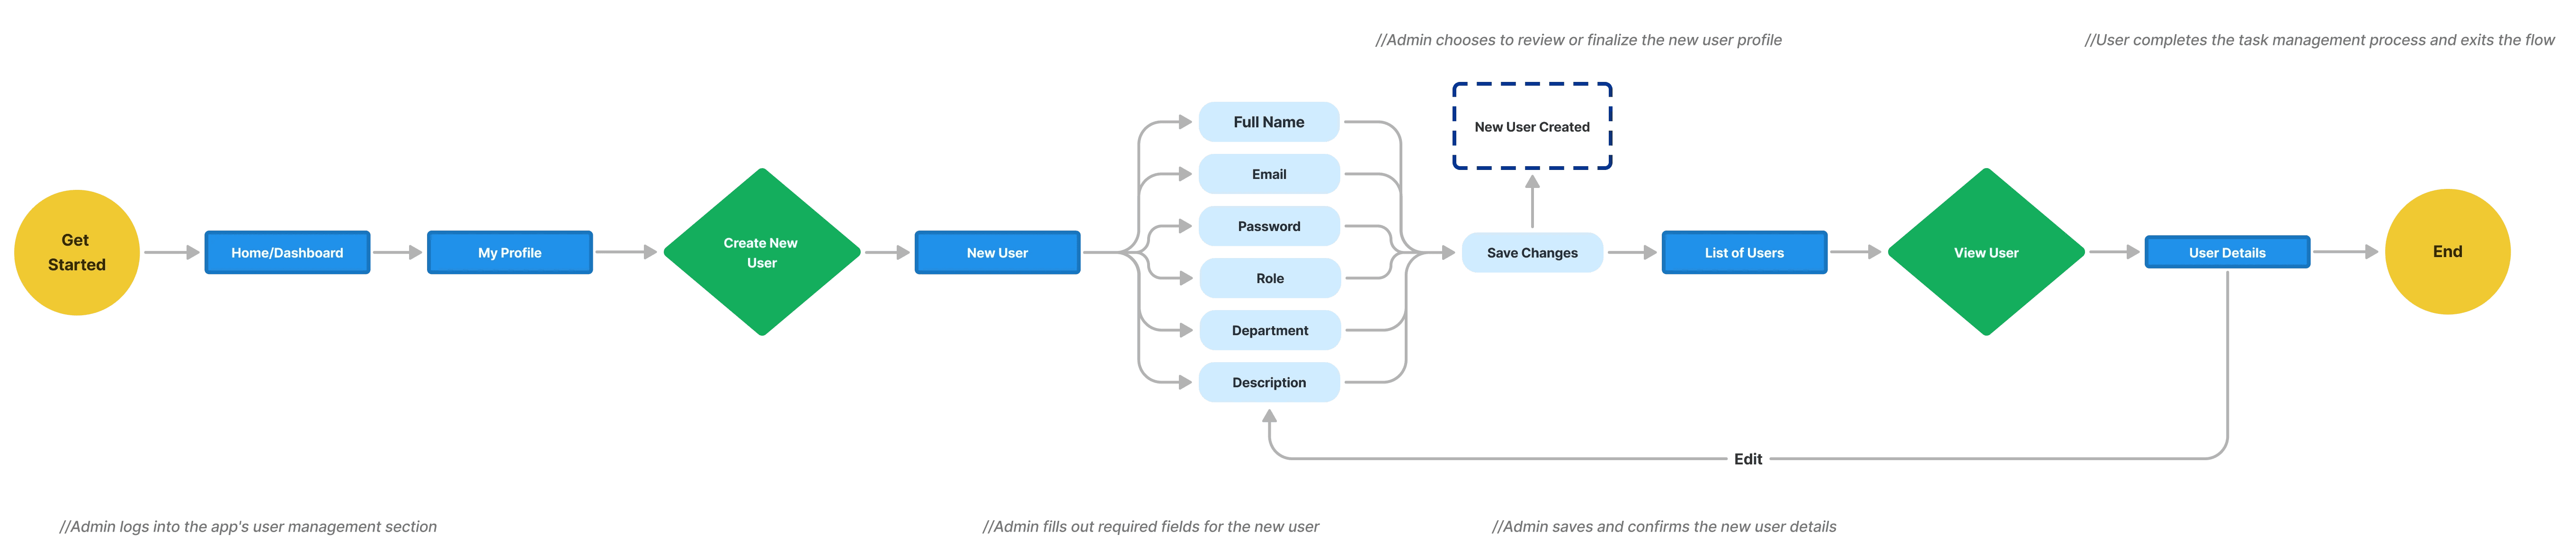
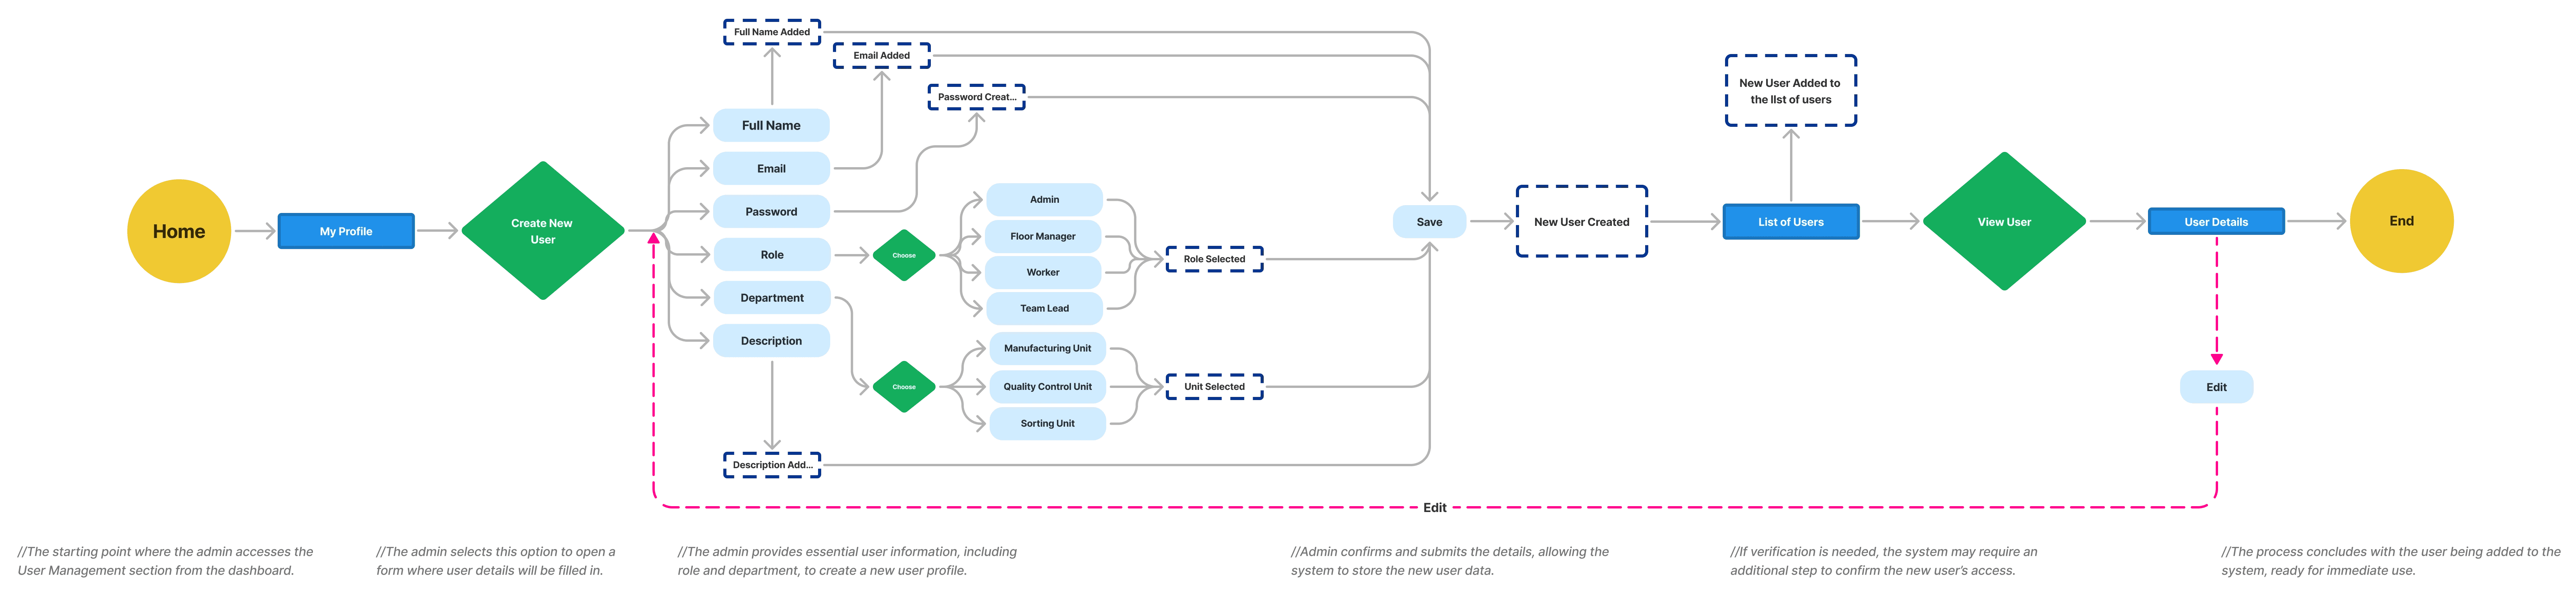
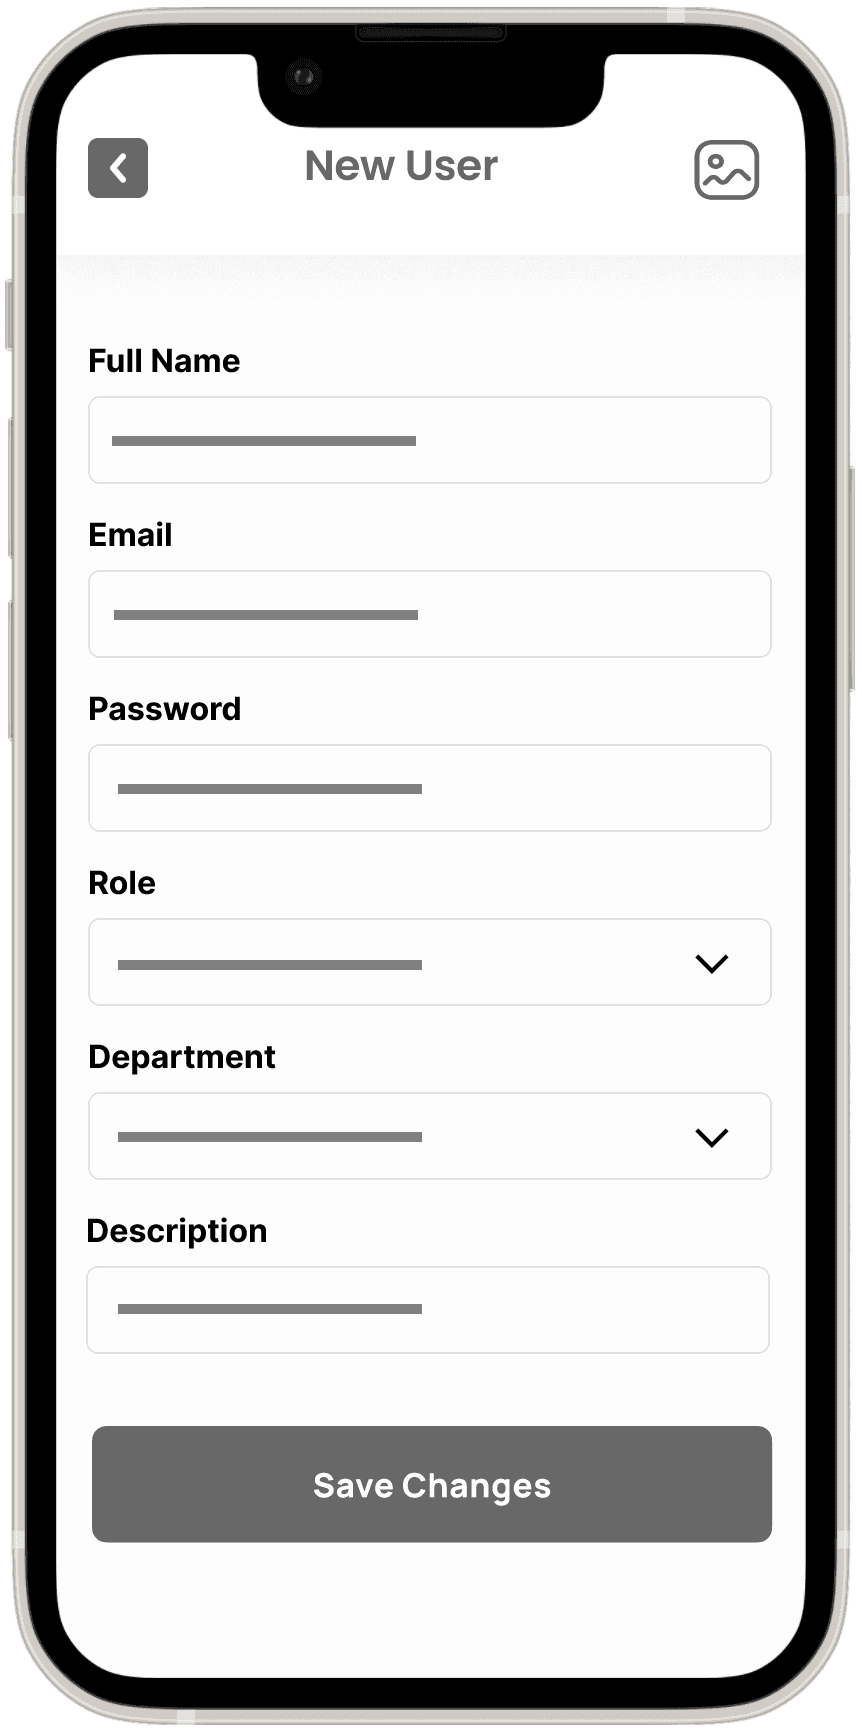
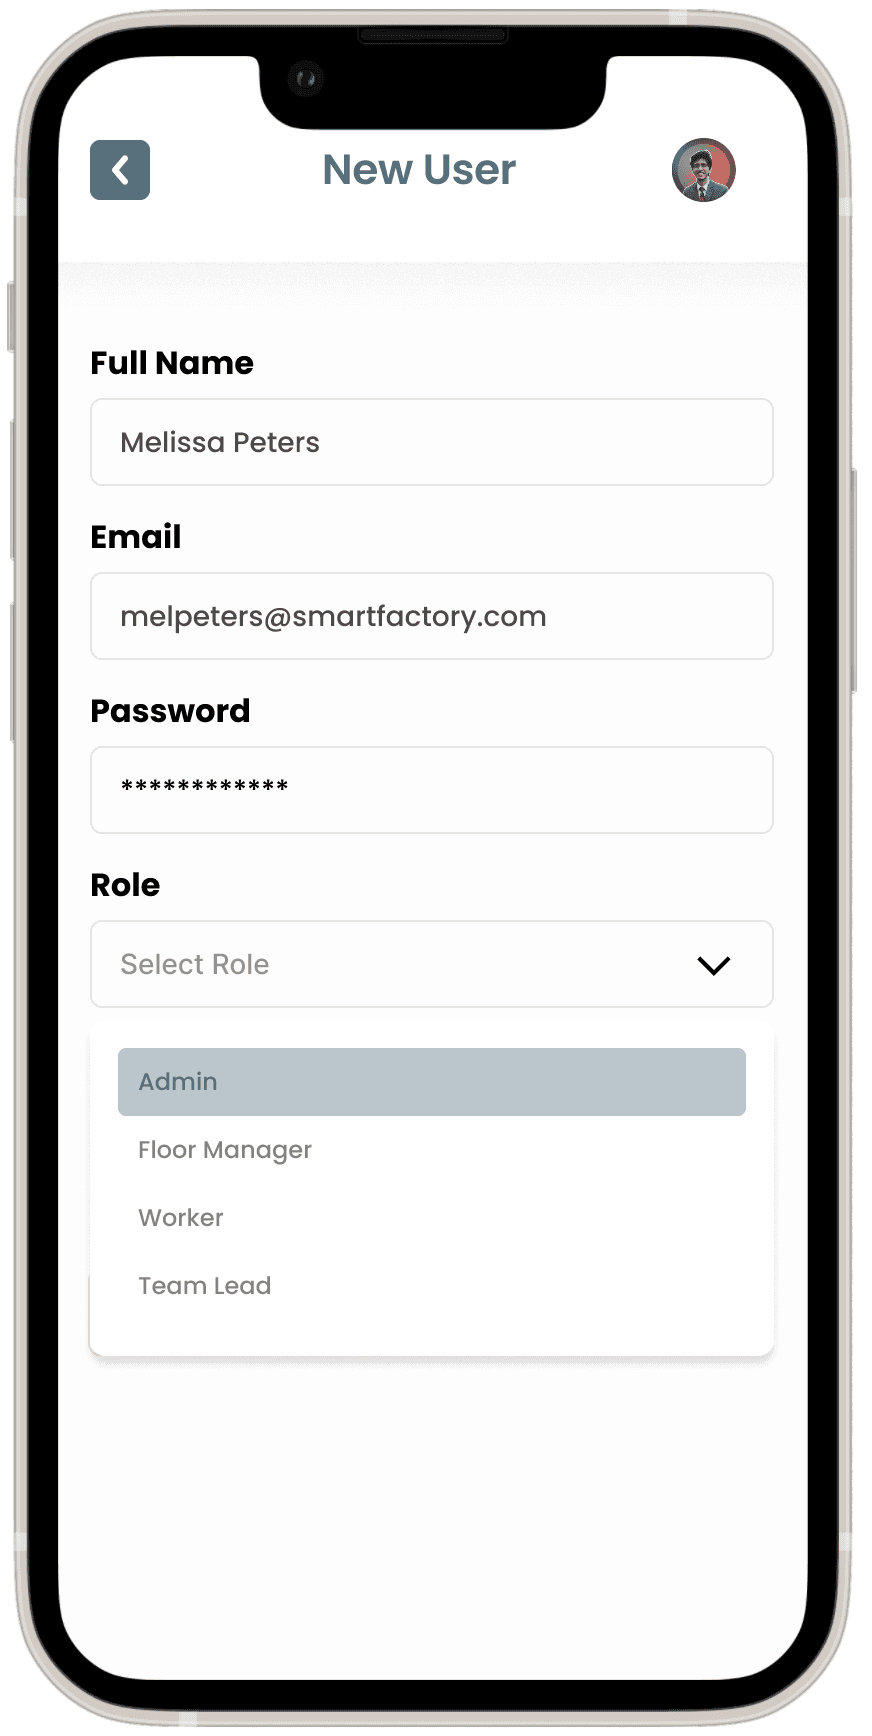
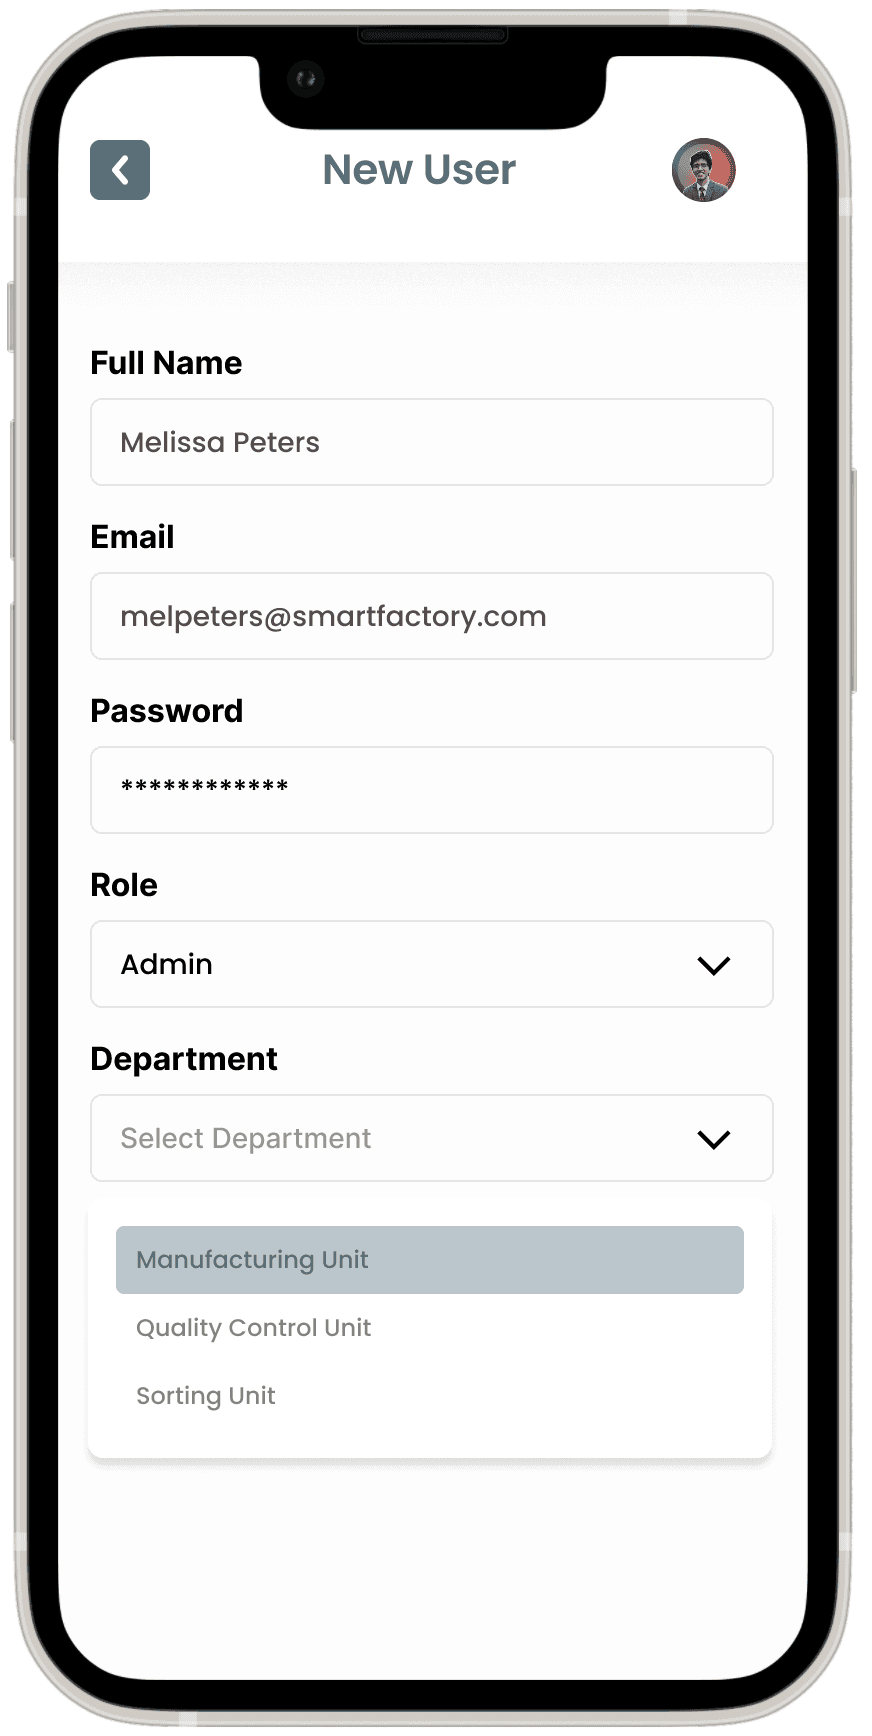
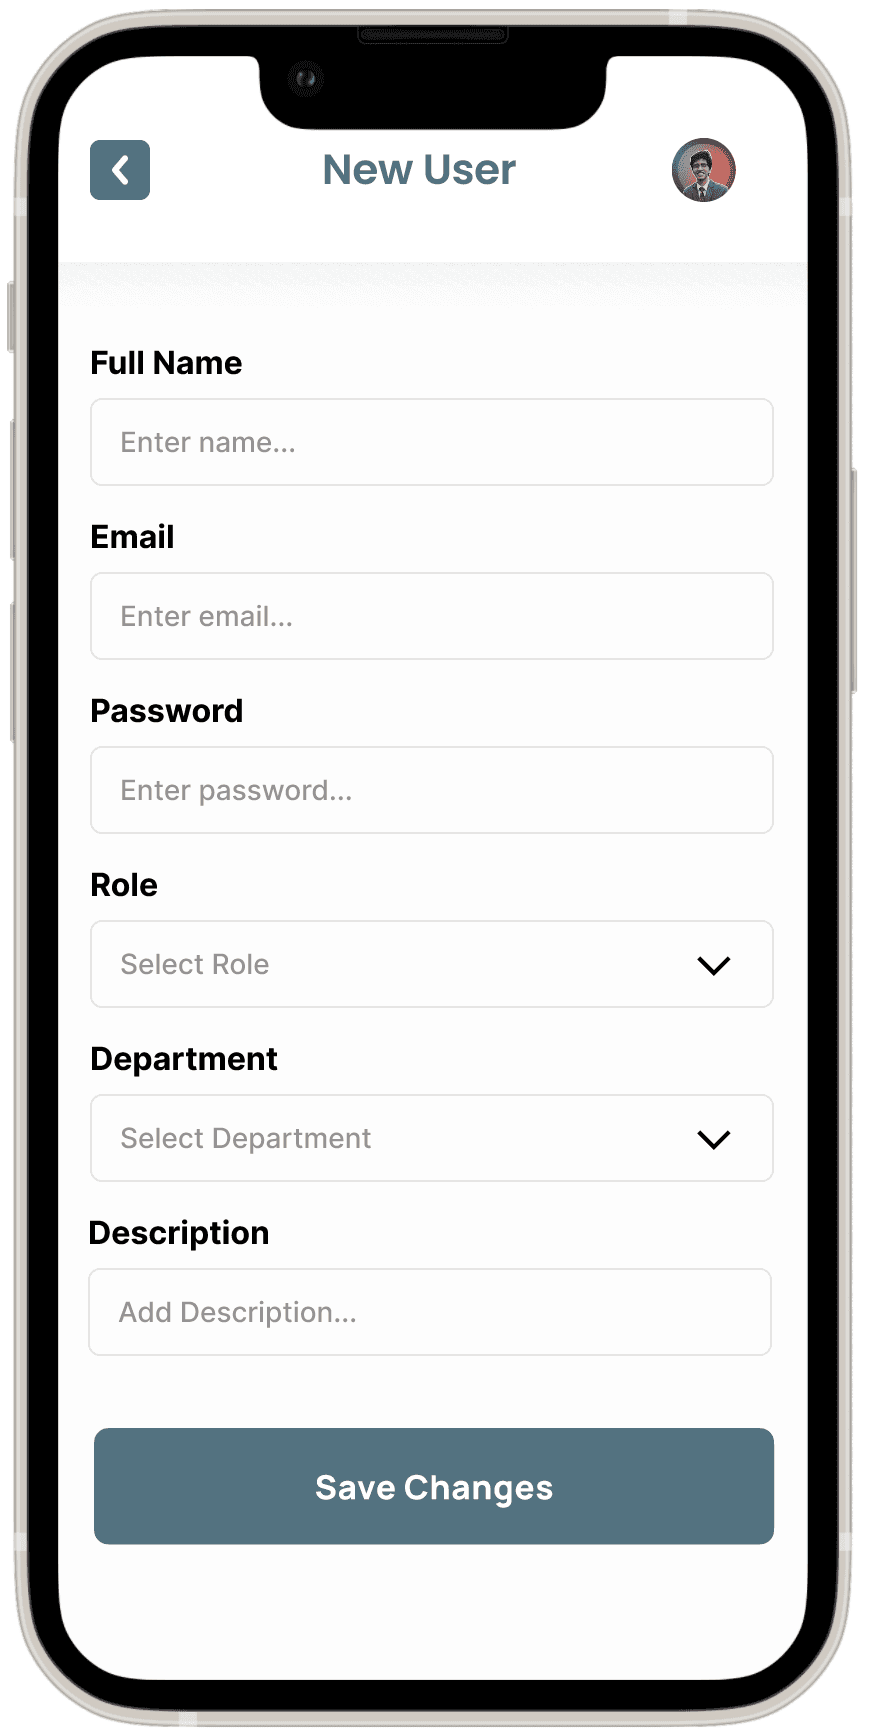
User Flow 2: Creating New User
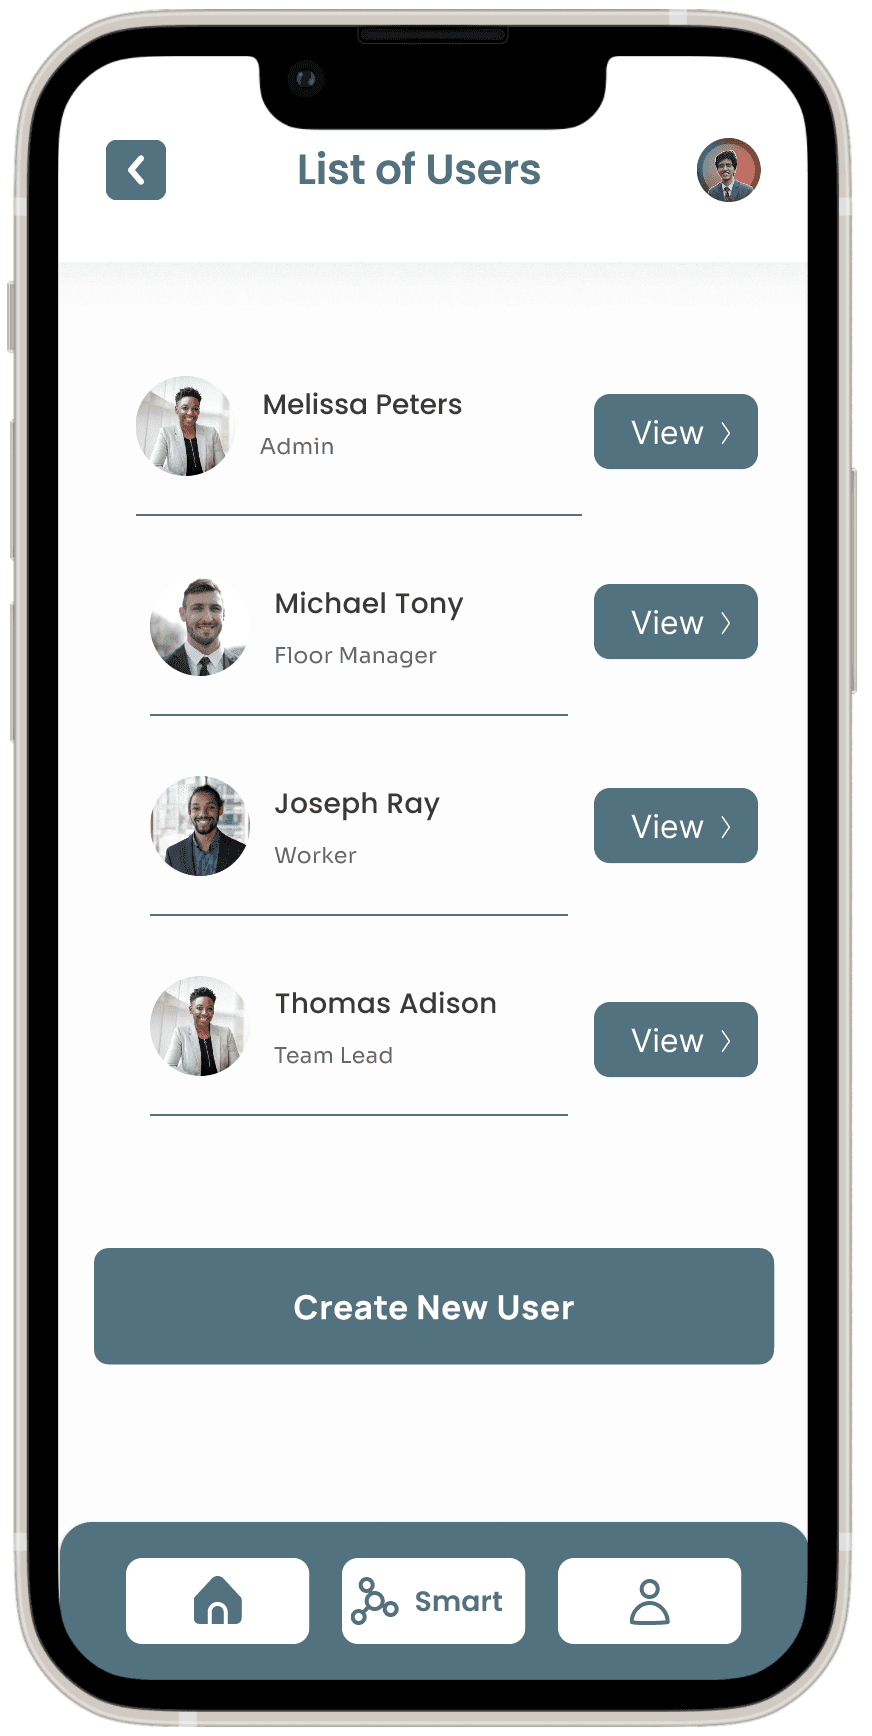
Objective: Help the admin navigate the process of creating and setting up a new user profile.
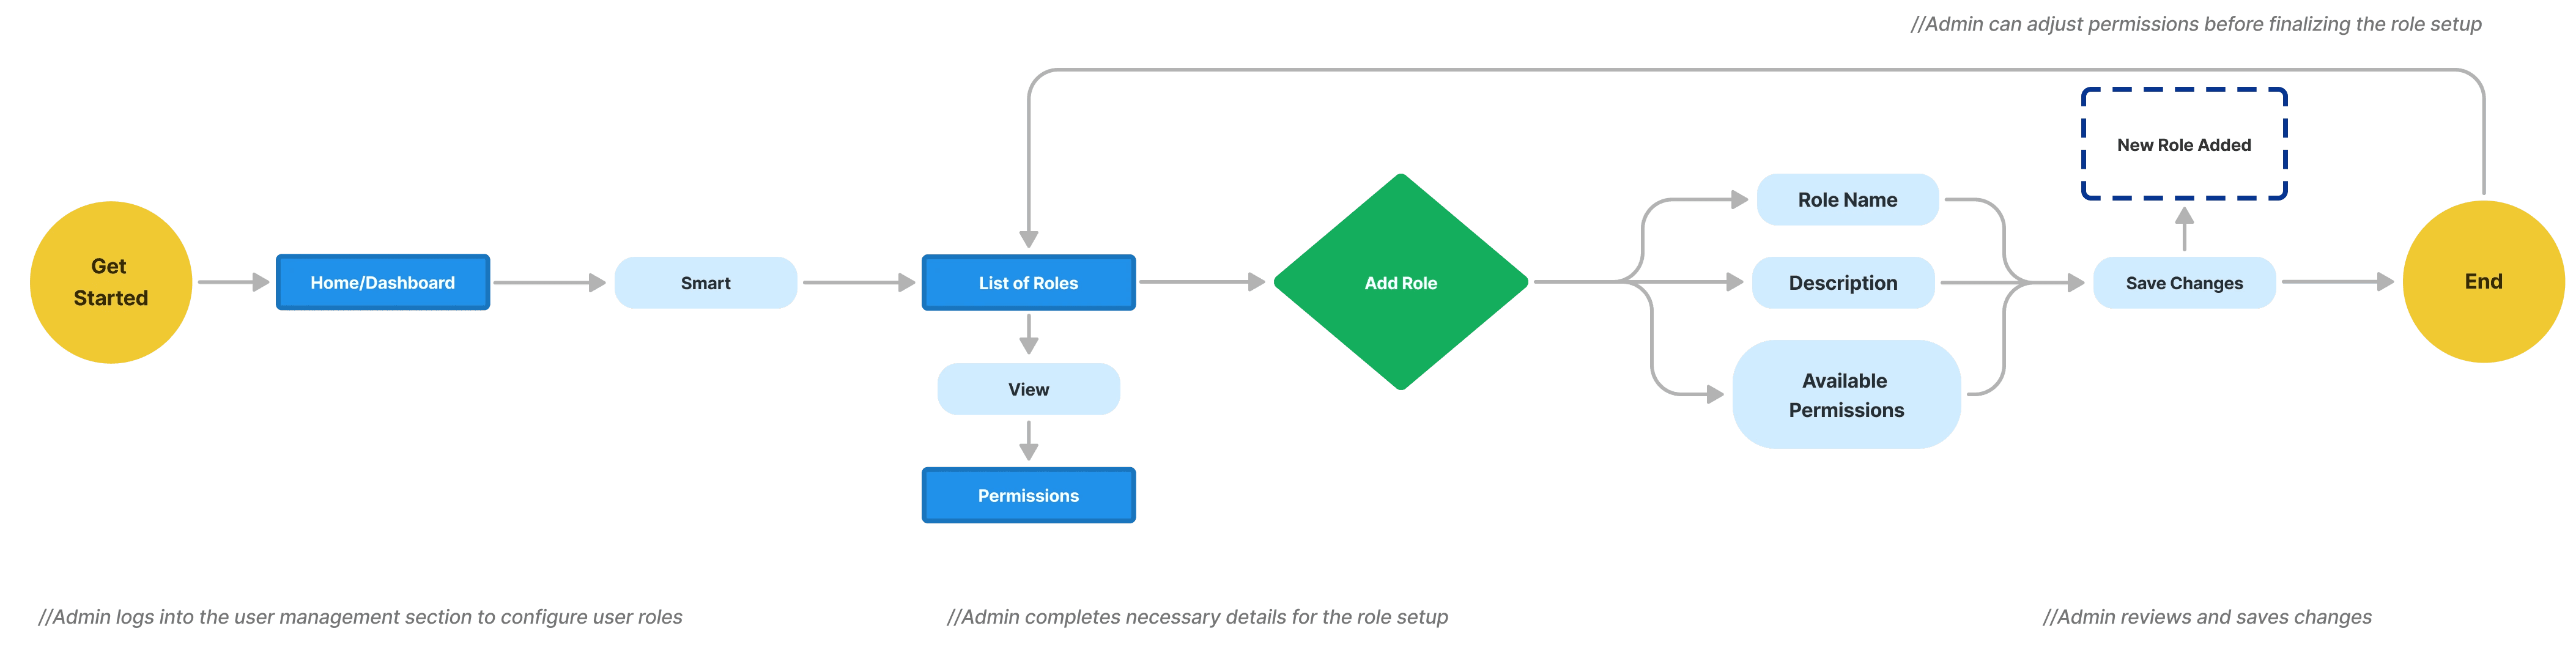
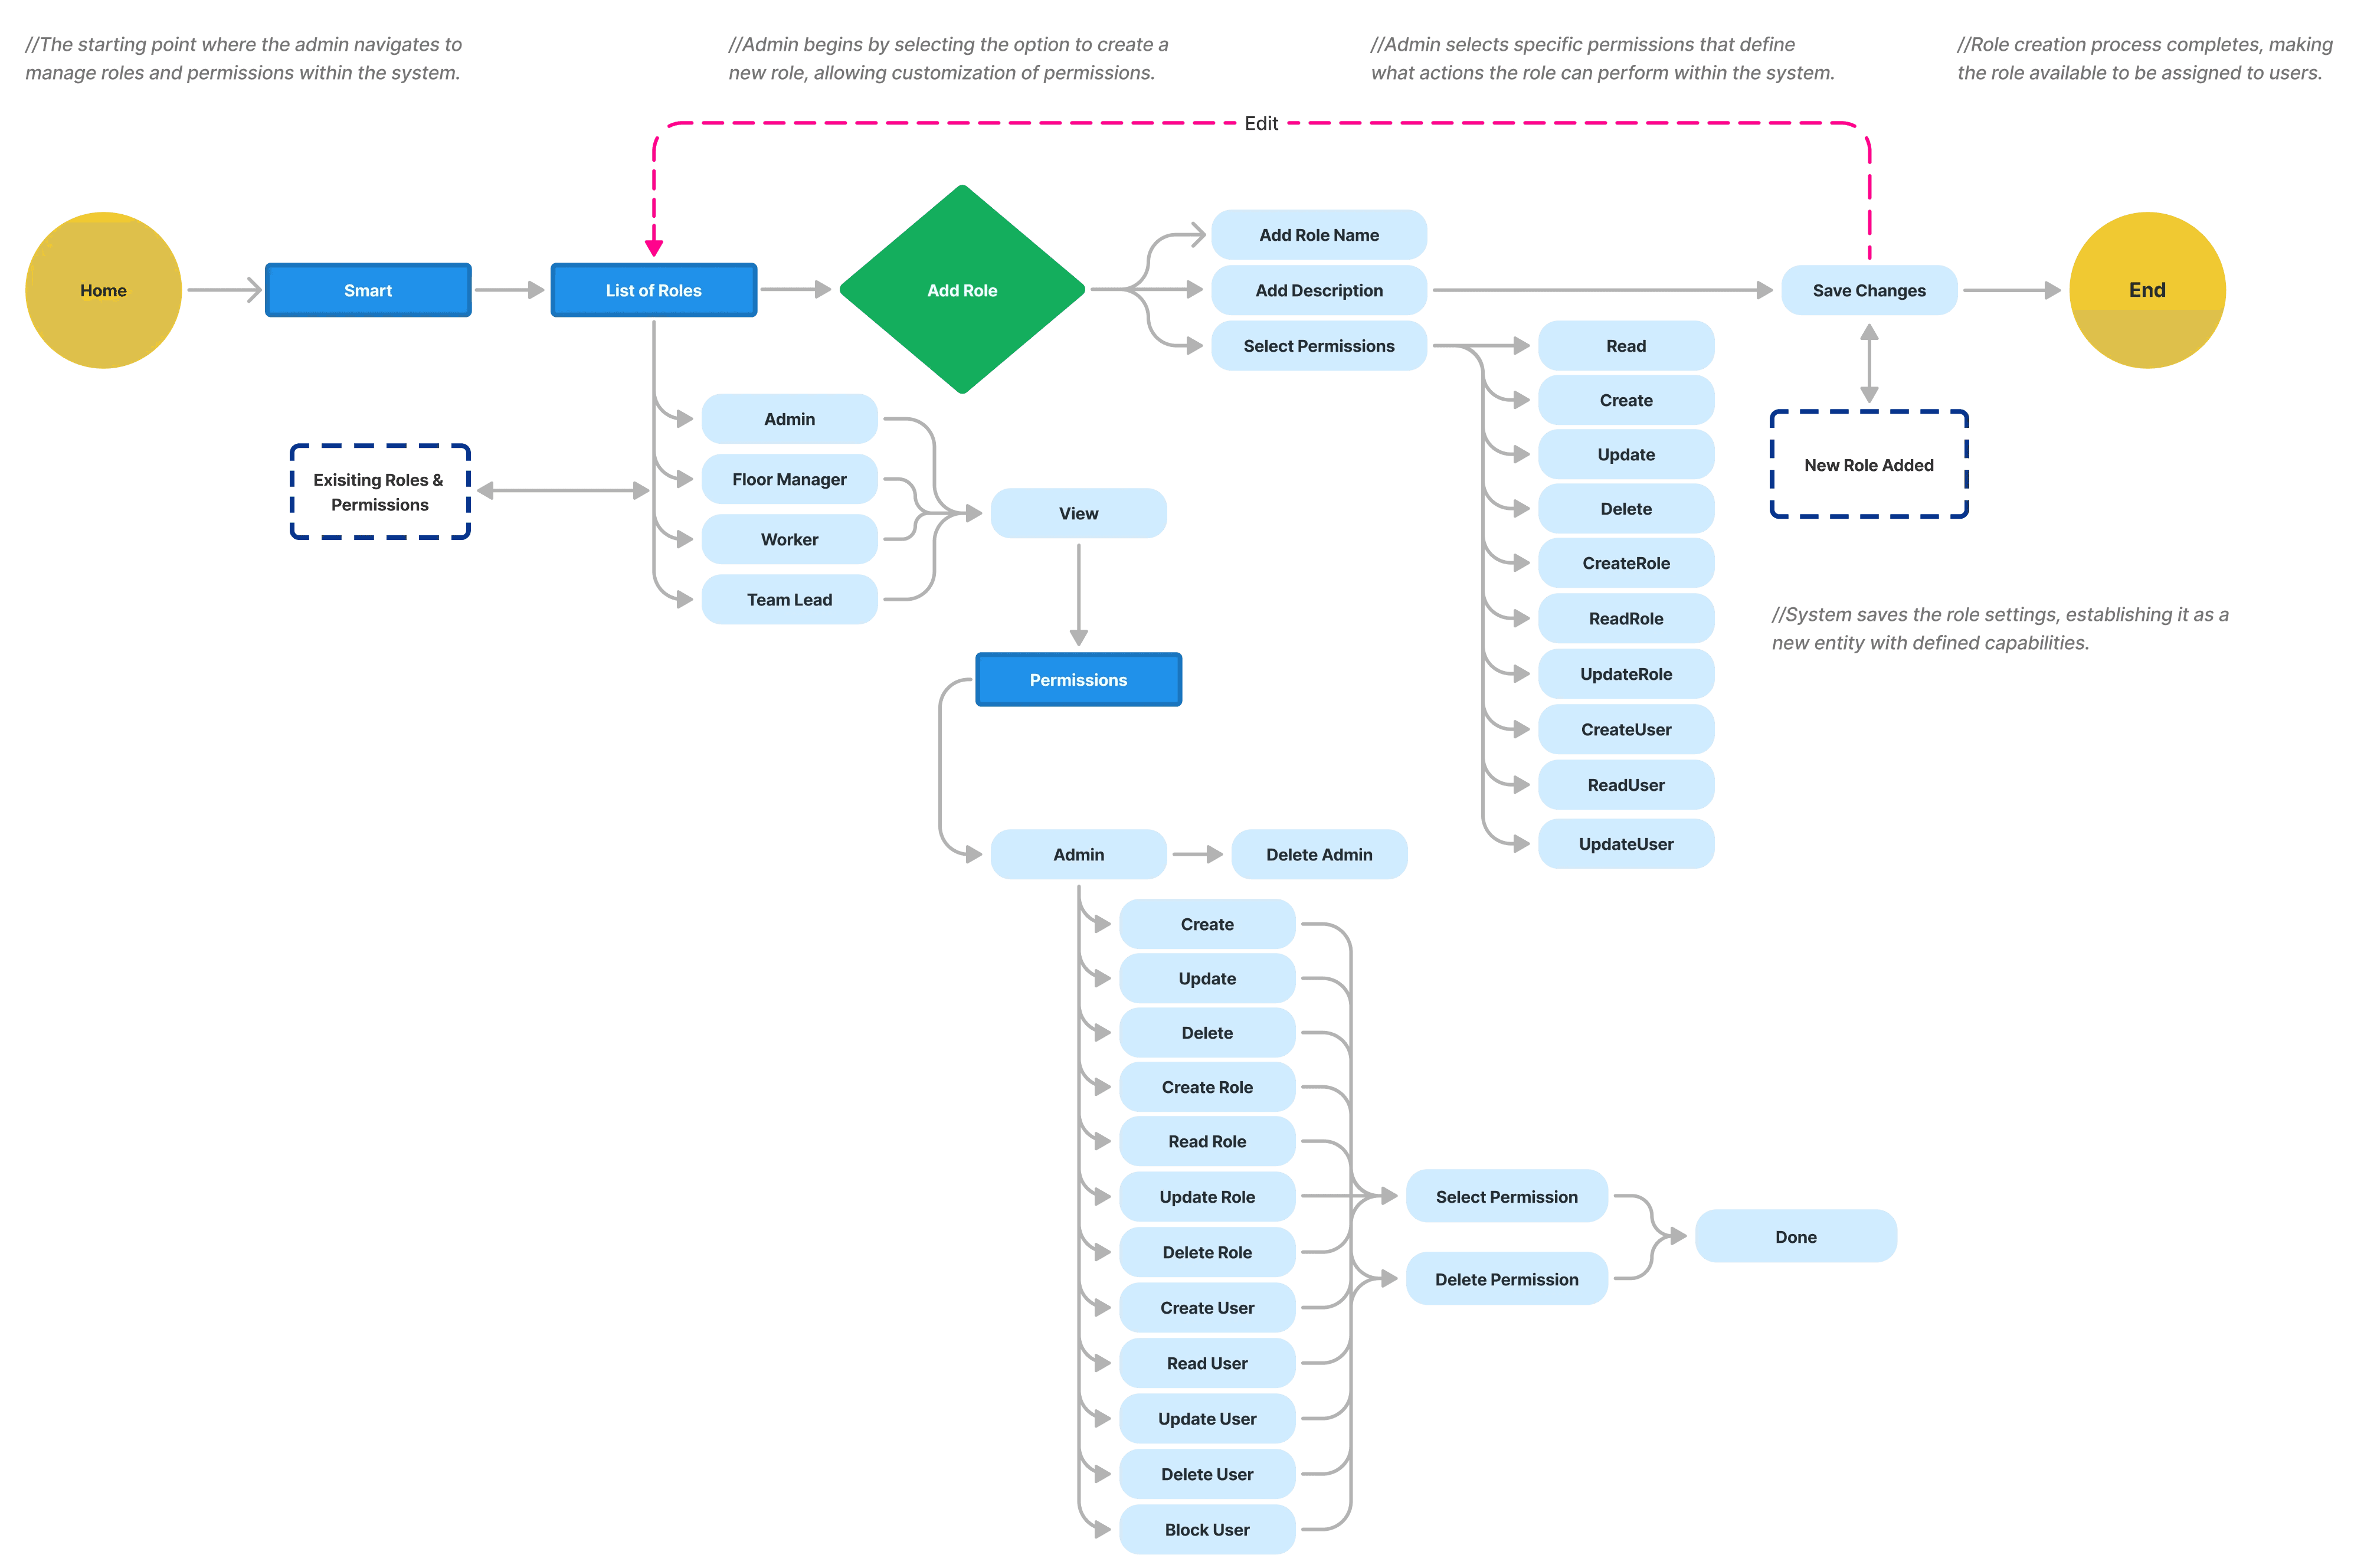
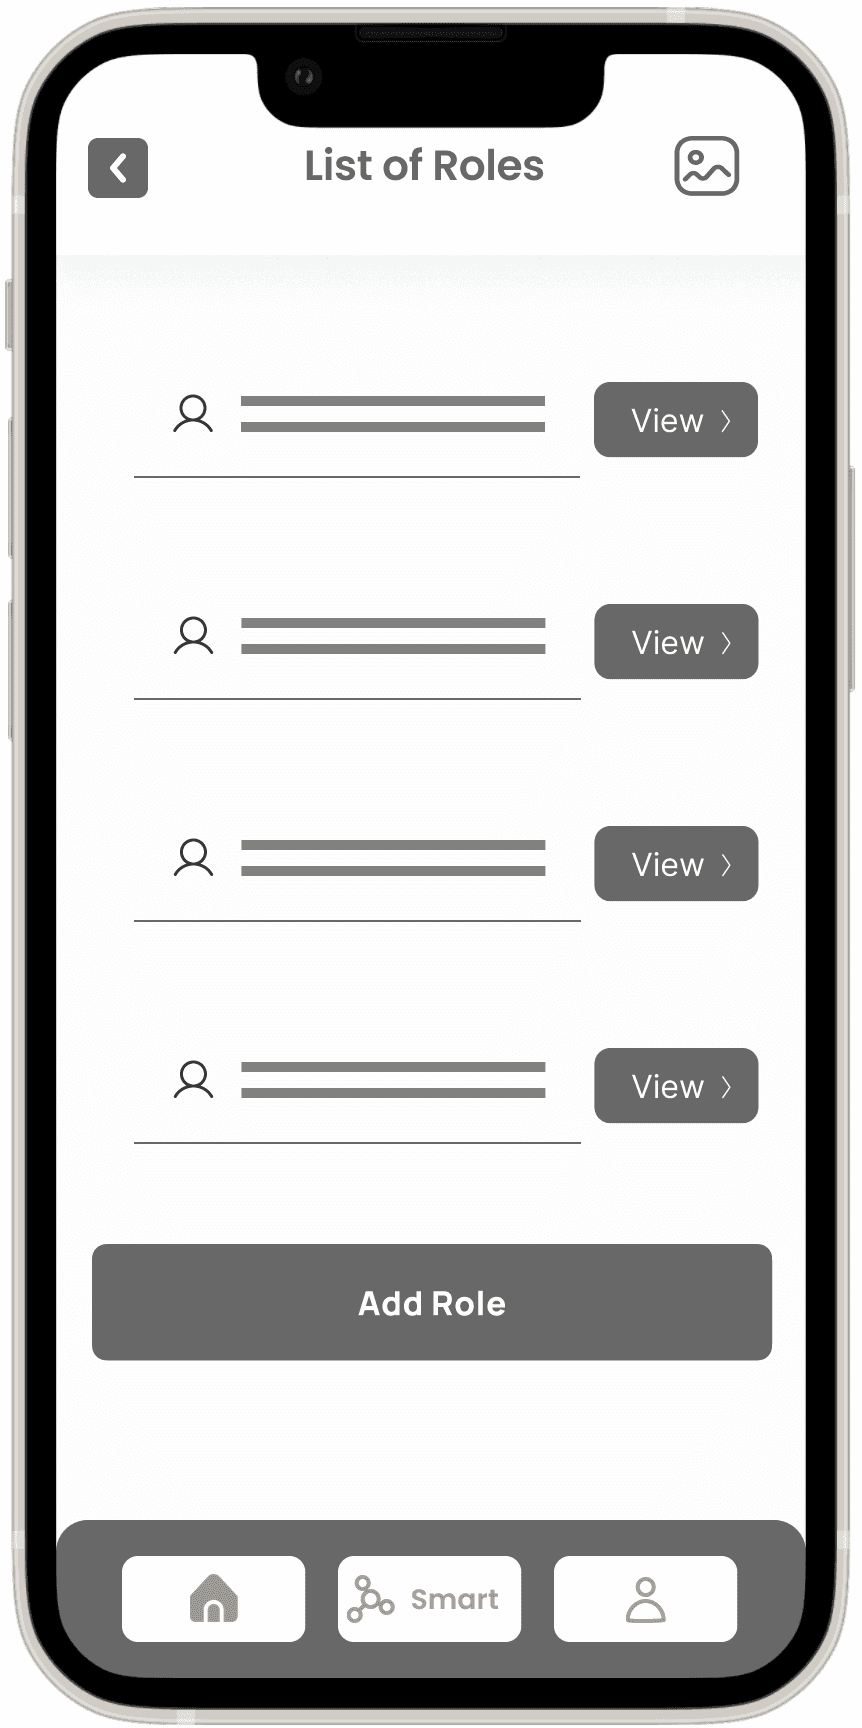
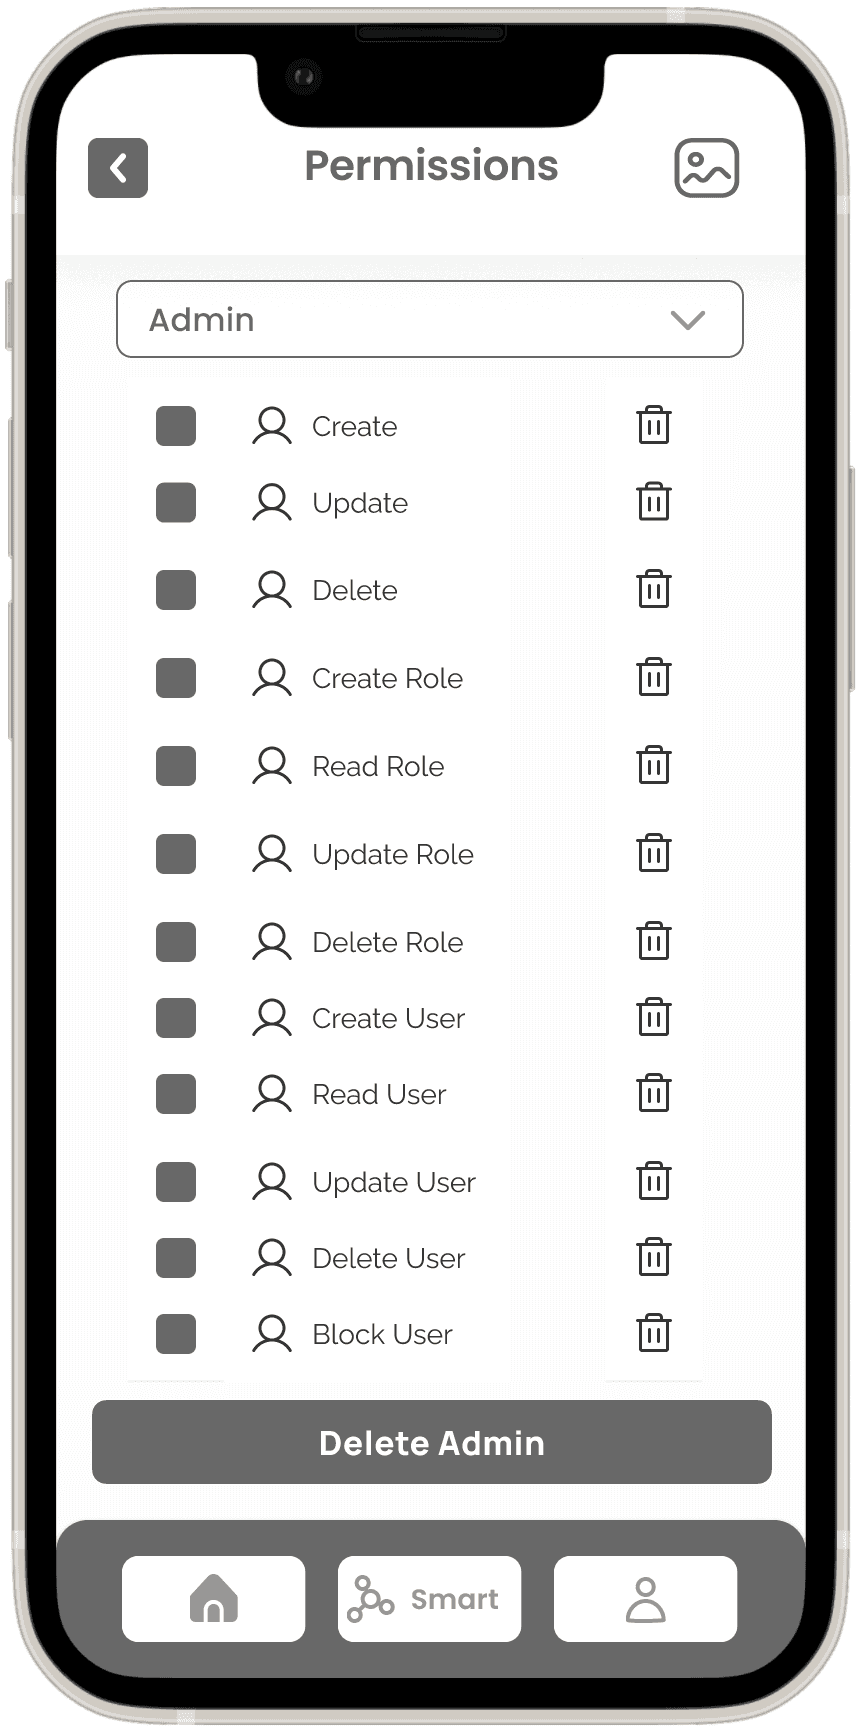
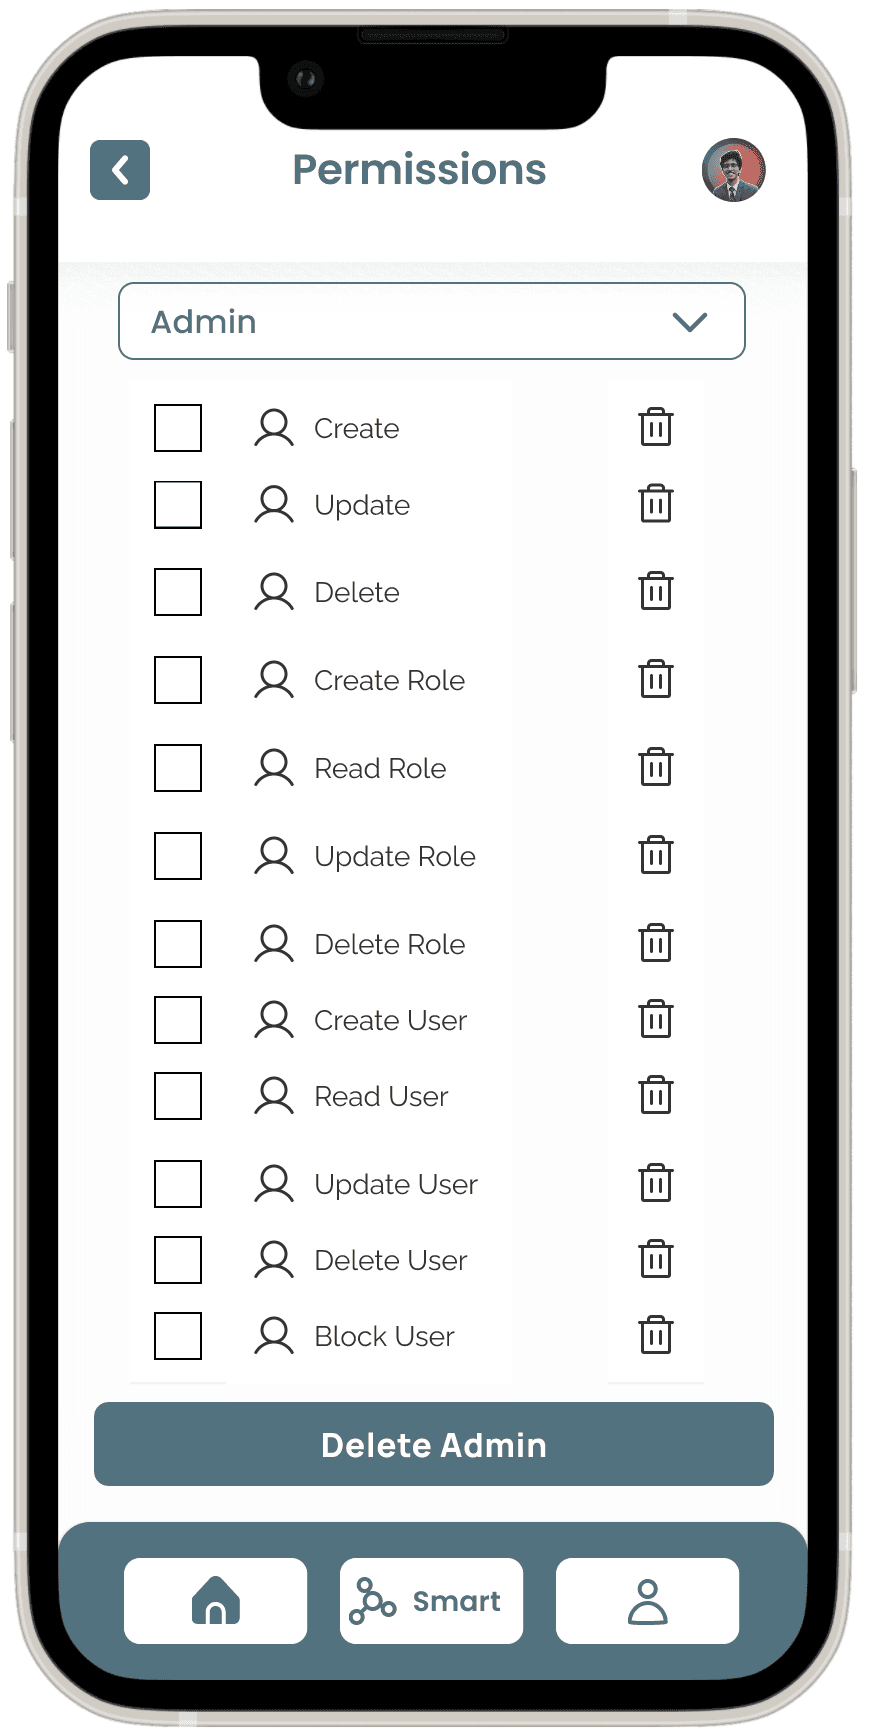
User Flow 3: Role and Permissions Configuration
Objective: Walk the admin through assigning roles and setting permissions for users.
Task Flows
Task flows were designed to break down specific interactions within the app, such as setting up a task, receiving a reminder, and marking a task as complete, to ensure smooth and intuitive processes.
Task Flow 1: Widget Creation
Objective: Guide the user through creating a new widget to monitor factory data in the Smart Factory system.
Task Flow 2: Creating a New User
Objective: Enable the system administrator to create and configure a new user in the Smart Factory system.
Task Flow 3: Adding a New Role and Assigning Permissions
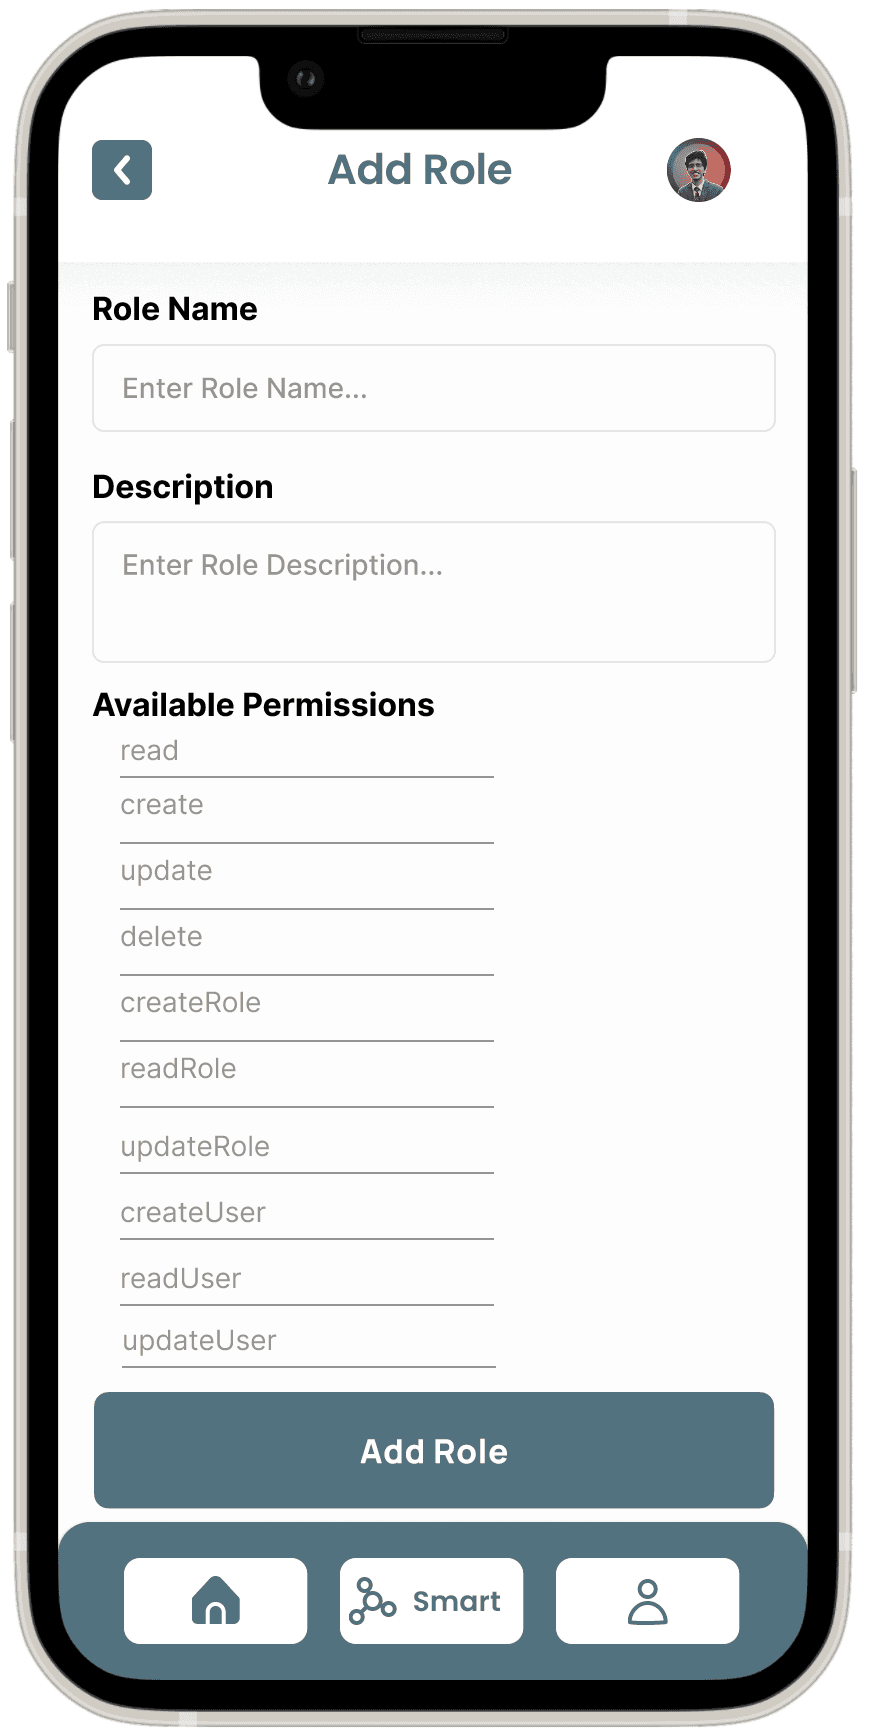
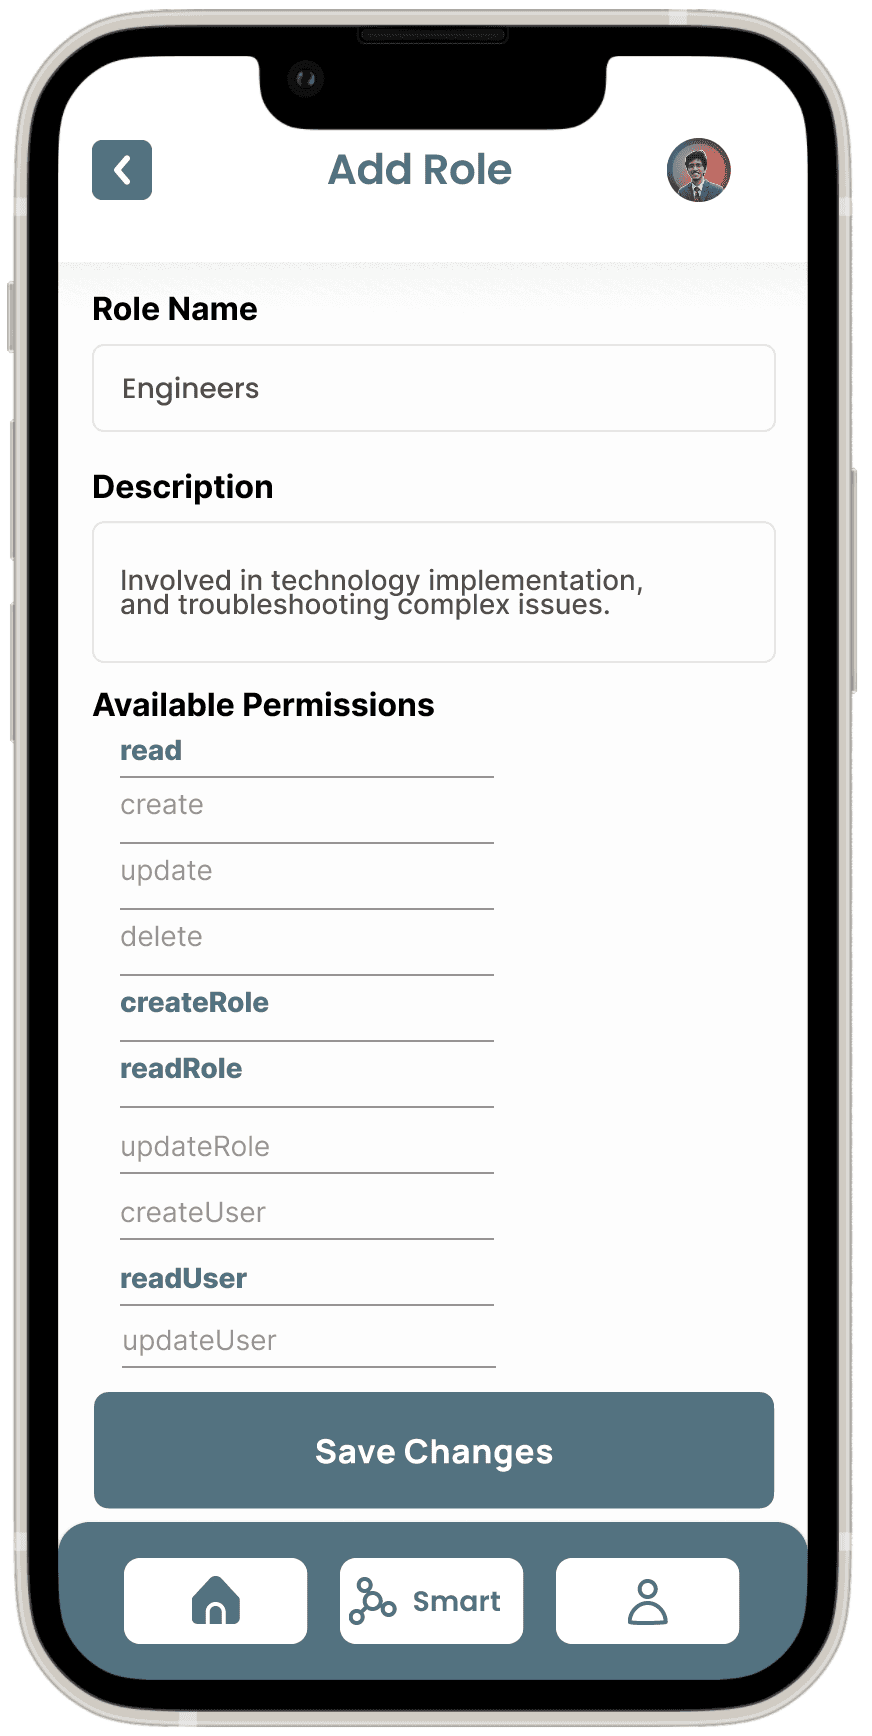
Objective: Allow the admin to define new roles within the system and assign specific permissions to those roles.
Low-Fidelity Screens
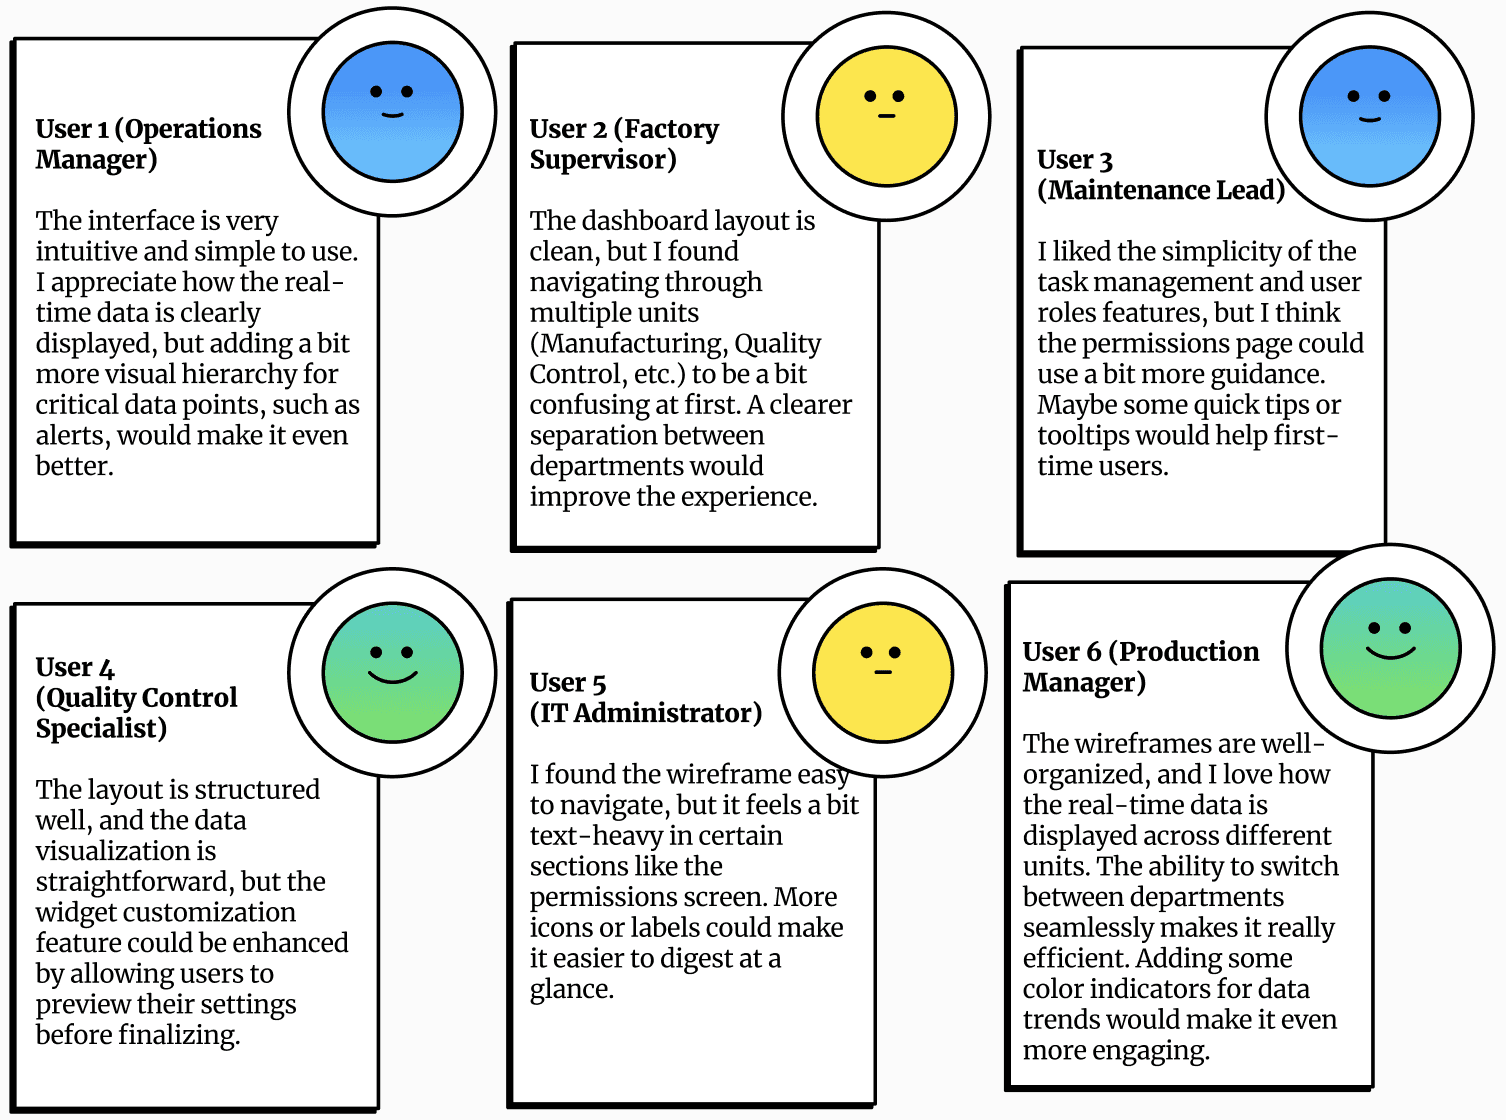
Wireframe Feedback
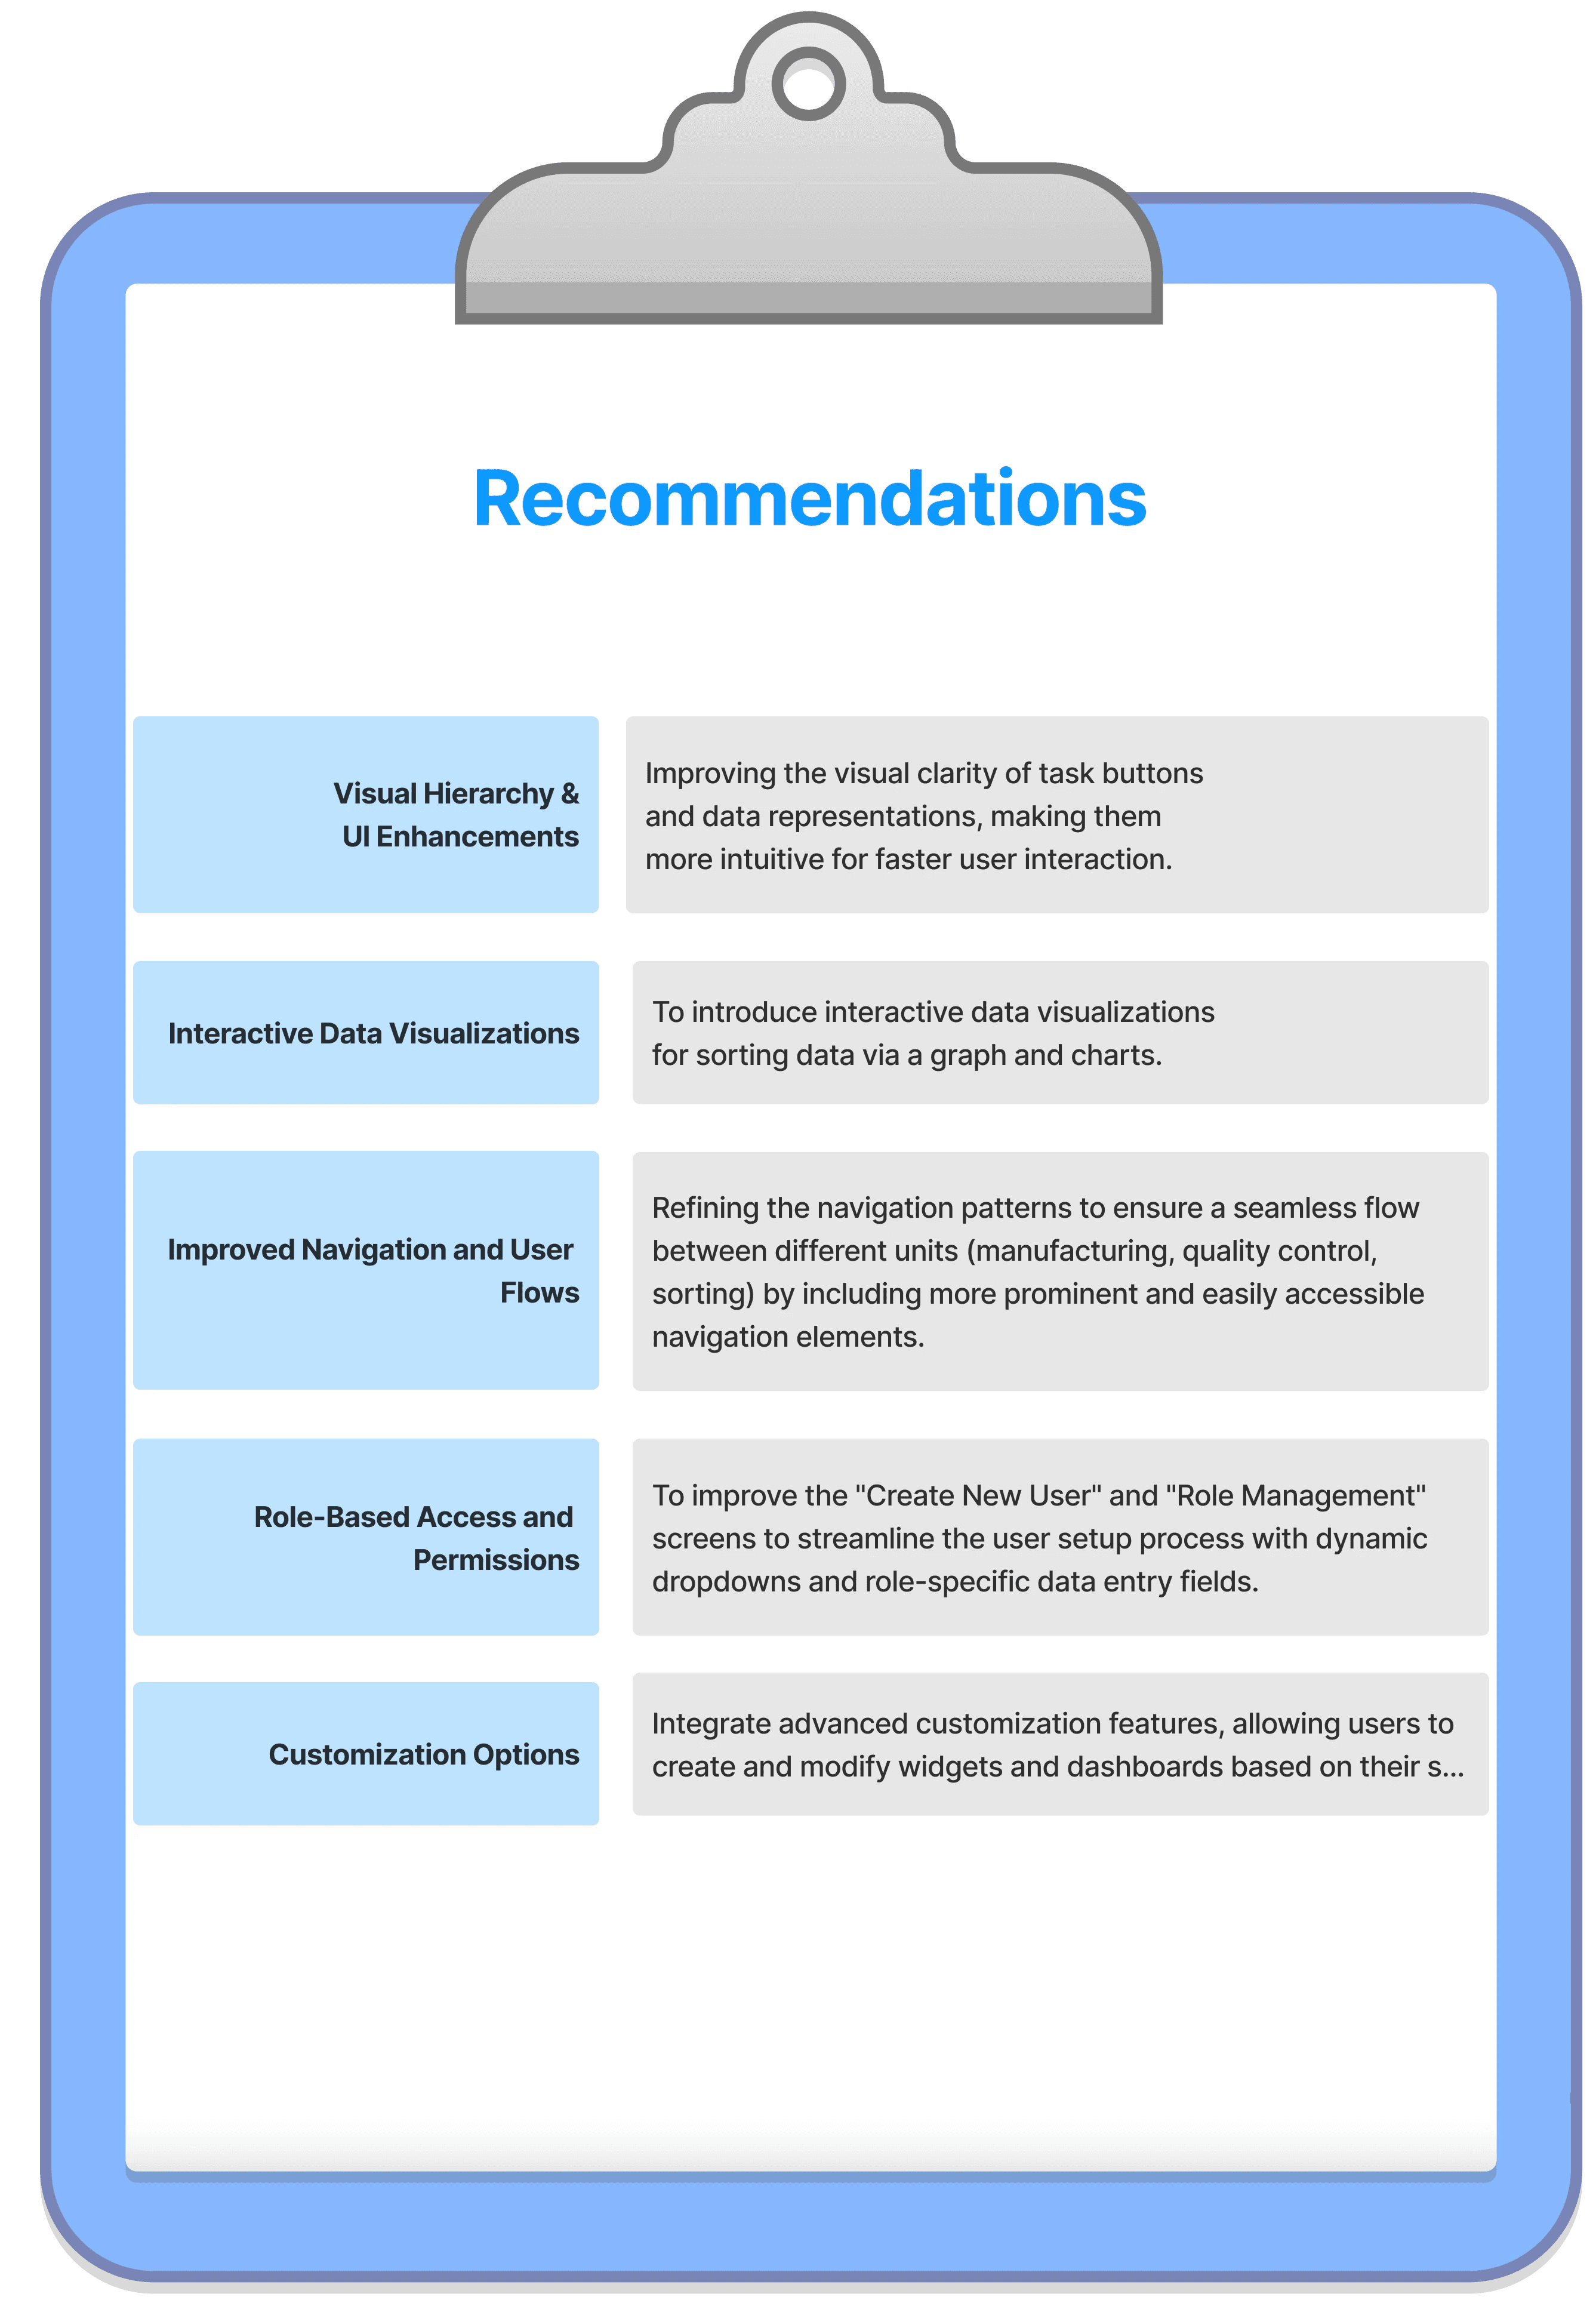
Recommendations for High-Fidelity Wireframe
Wireframes
The Wireframes section for the Smart Factory Application presents a structured low-fidelity representation of the user interface and interactions within the app. Leveraging insights from the sitemap, user flows, and task flows, I have designed the low-fidelity wireframes to establish the foundational layout and functionality of the application.
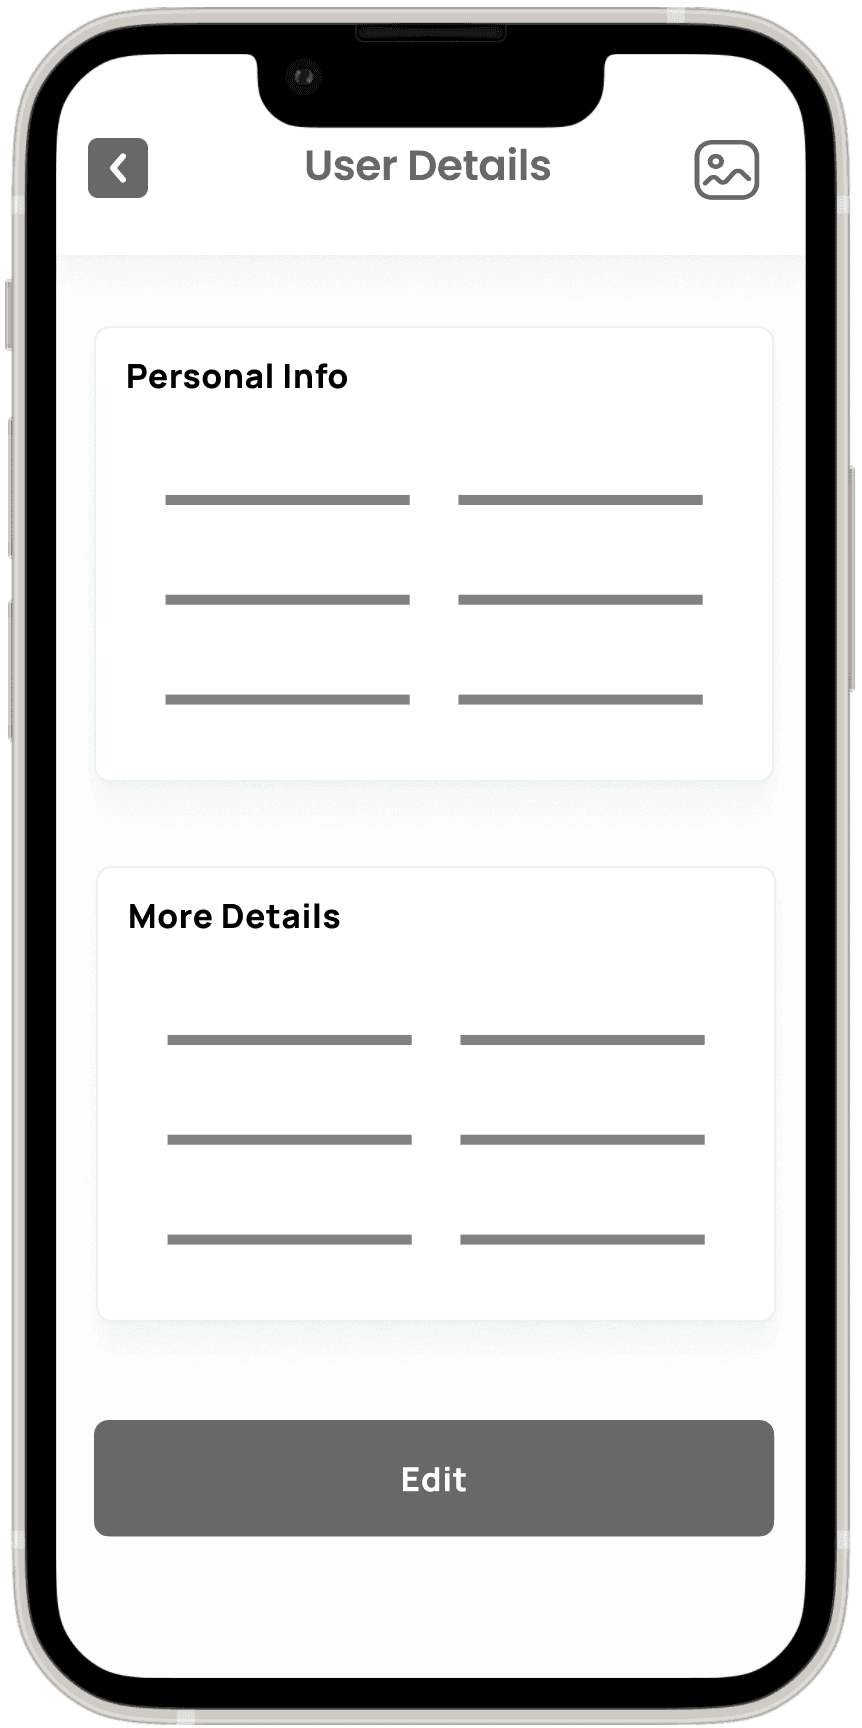
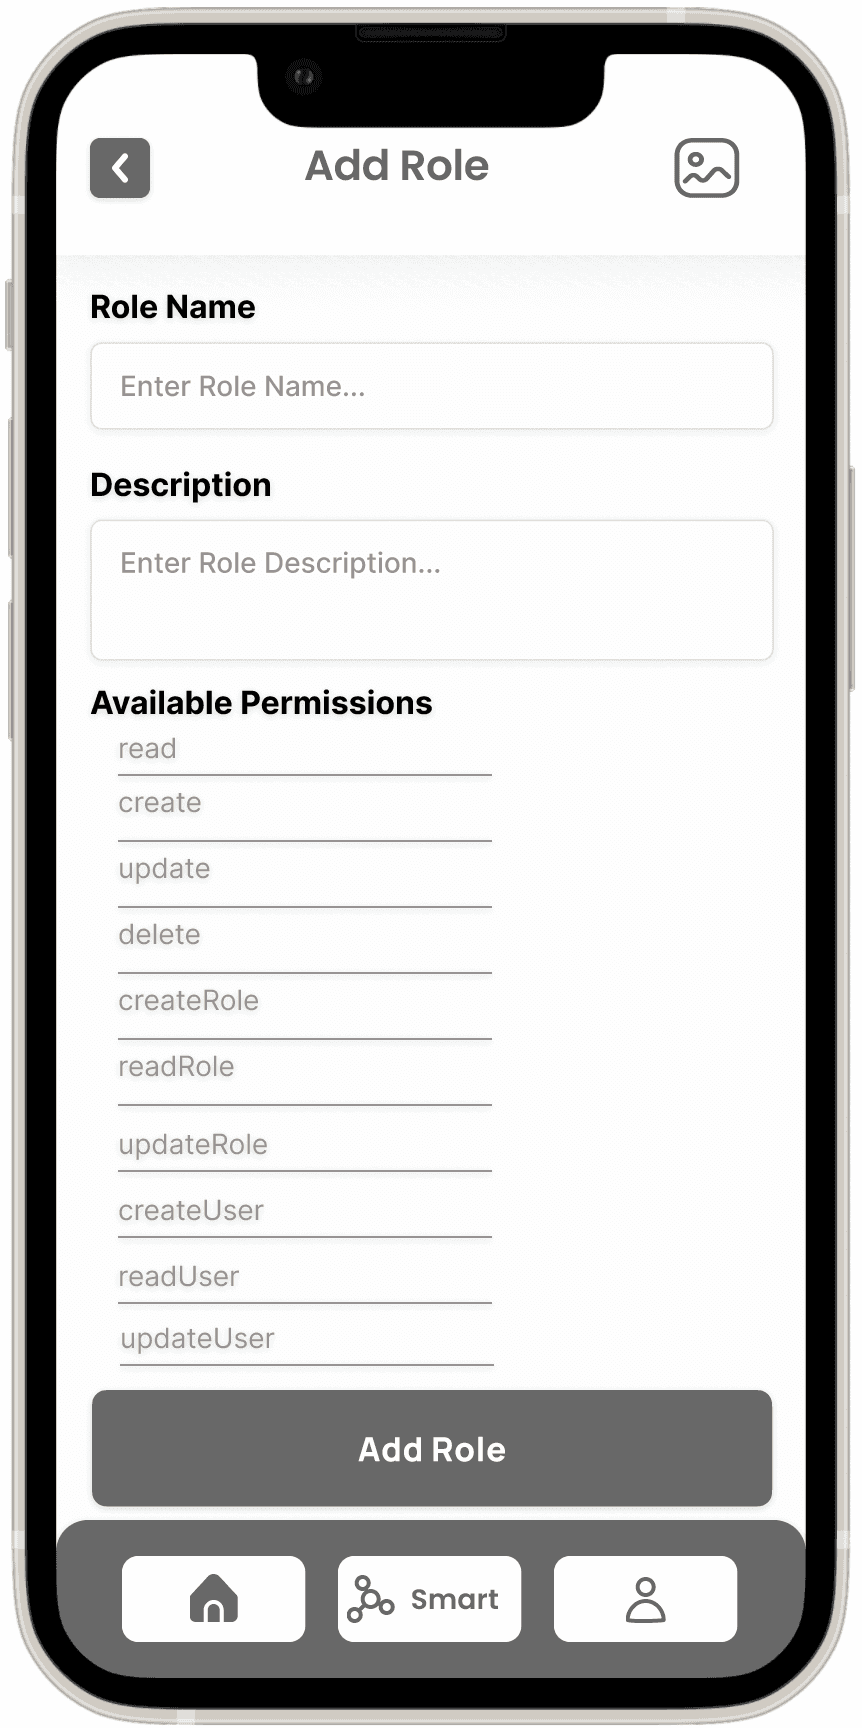
Main wireframe screens include:
Widget Creation Screen
Dashboard Overview Screen
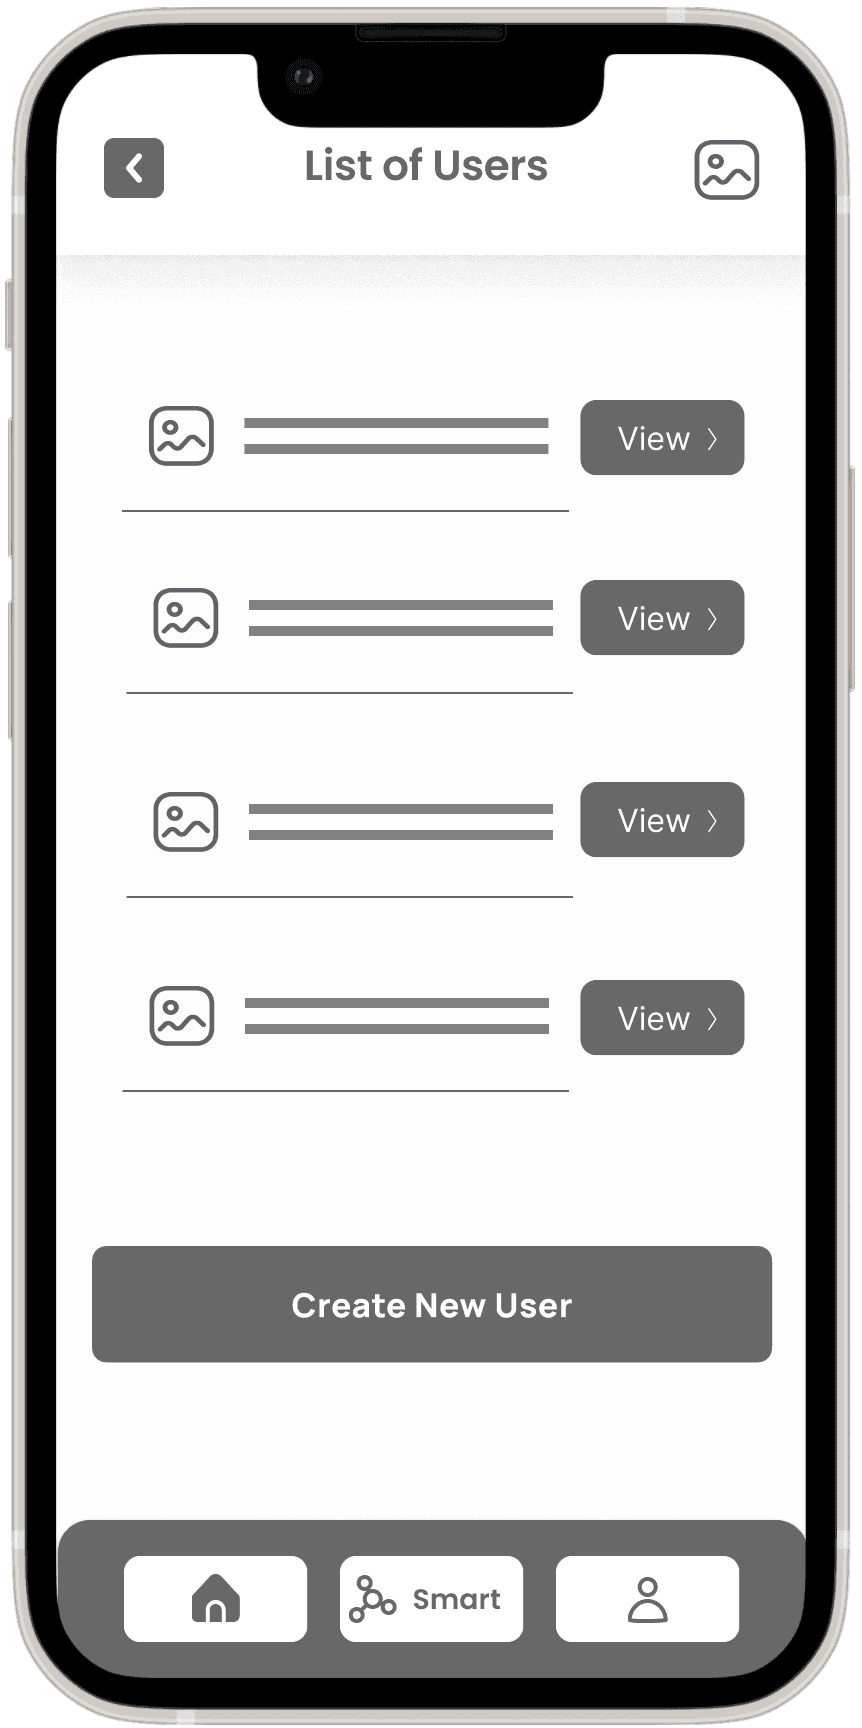
User Management Screen
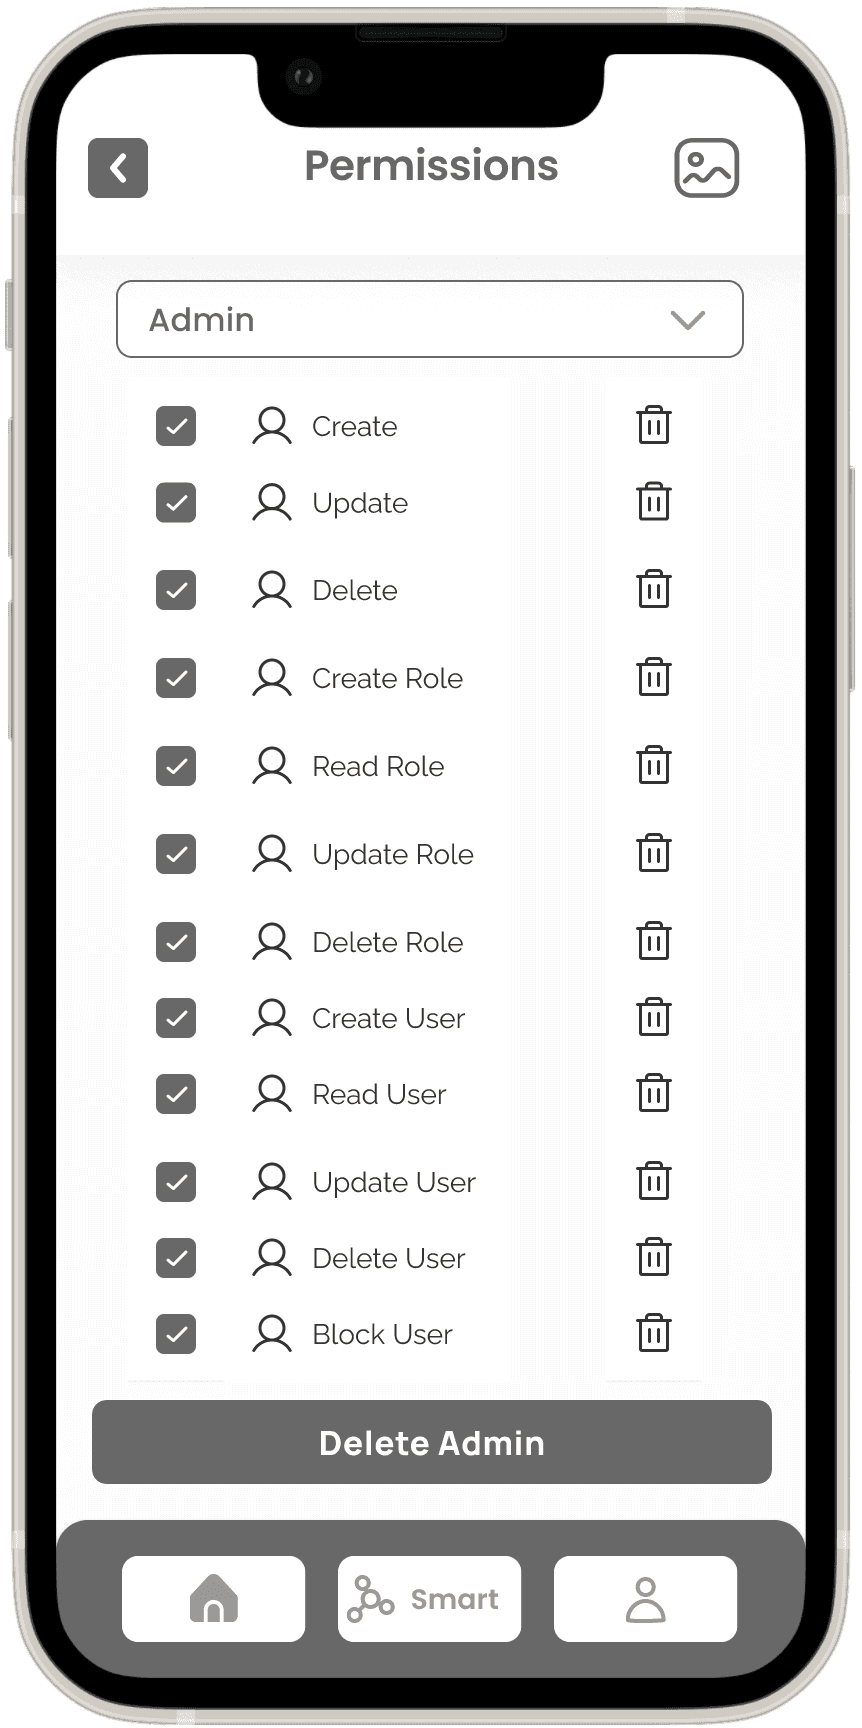
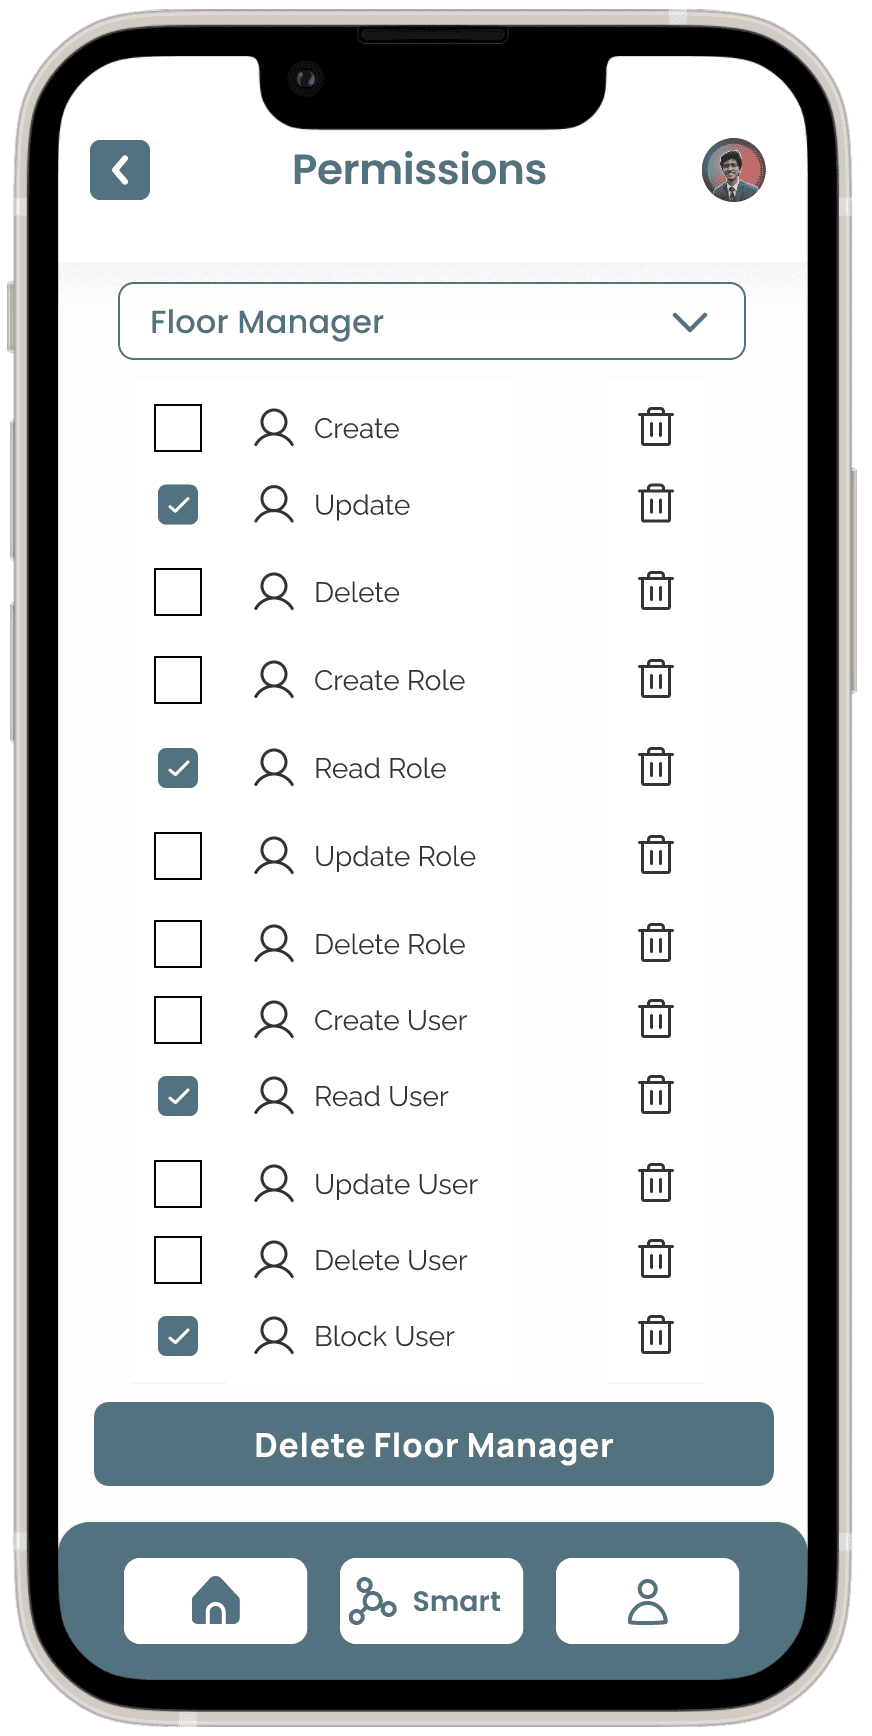
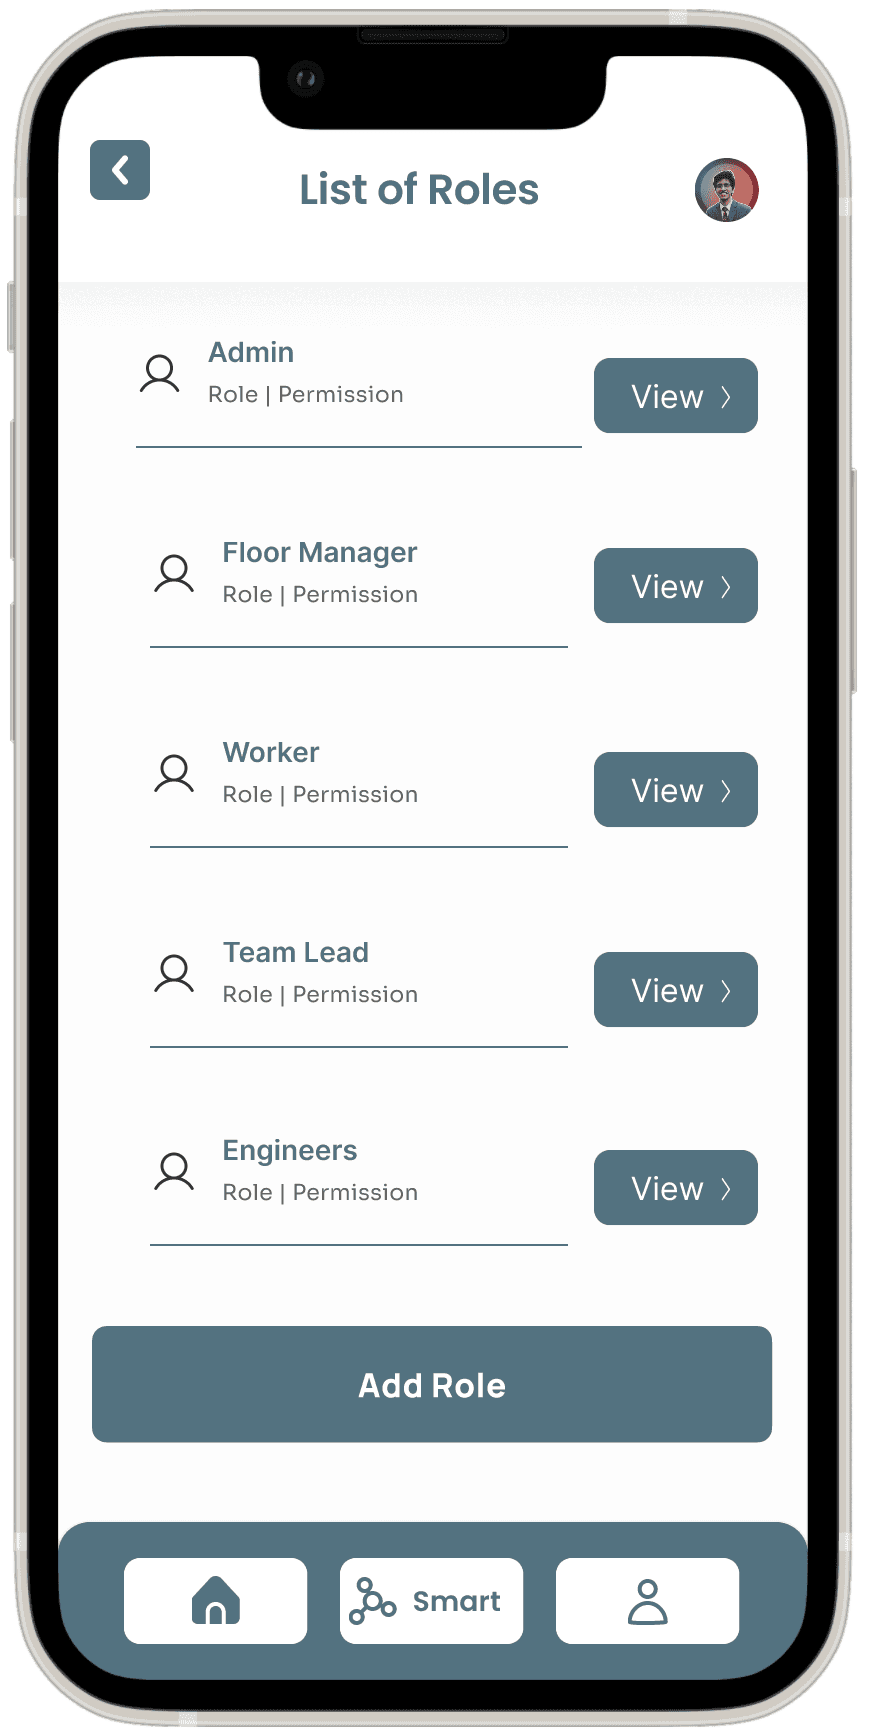
Role and Permissions Screen
Data Visualization Pop-Up Screen


UI Design
UI Library Components
The UI Library for the Smart Factory App is a carefully curated collection of reusable components that ensure design consistency across the entire interface. The library includes essential design elements such as buttons, icons, input fields, modals, and navigation bars, all optimized for industrial use with clarity and functionality at the forefront.
High-Fidelity Screens
The High-Fidelity Screens for the Smart Factory App provide a highly polished and realistic depiction of the final design and user interface. Created with precision in Figma, these screens bring the application to life, offering an interactive prototype that closely mirrors the intended user experience.
These high-fidelity designs ensure that every element of the interface—from visual hierarchy to interactive components—delivers an optimal user experience aligned with the goals of a smart factory. The prototype provides a near-realistic walkthrough of how users will interact with and benefit from the final product.
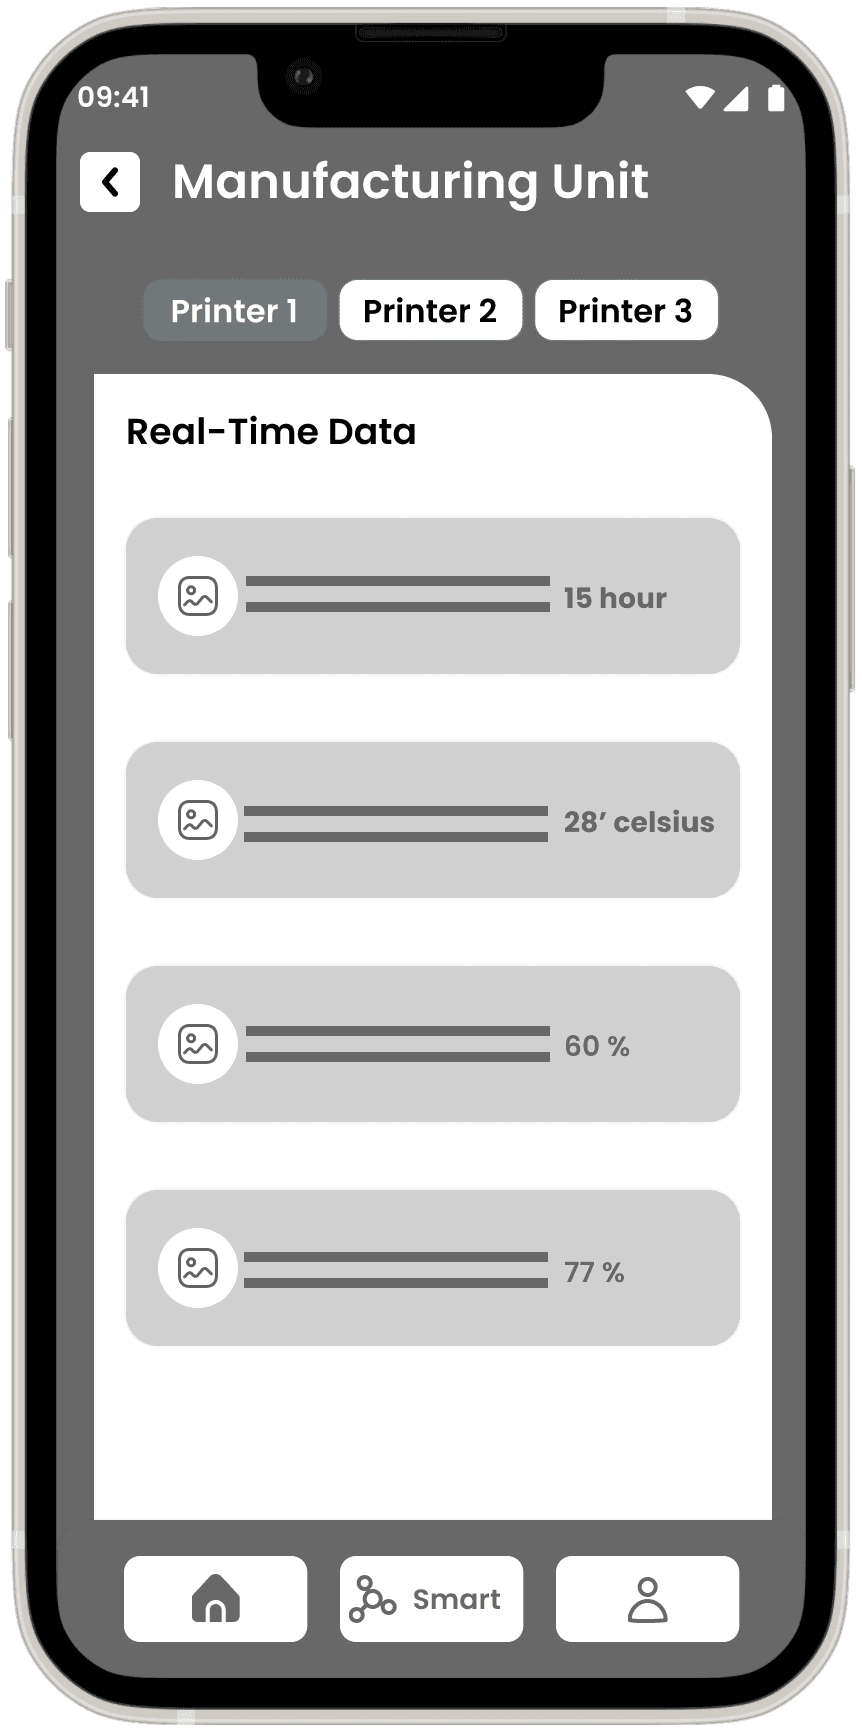
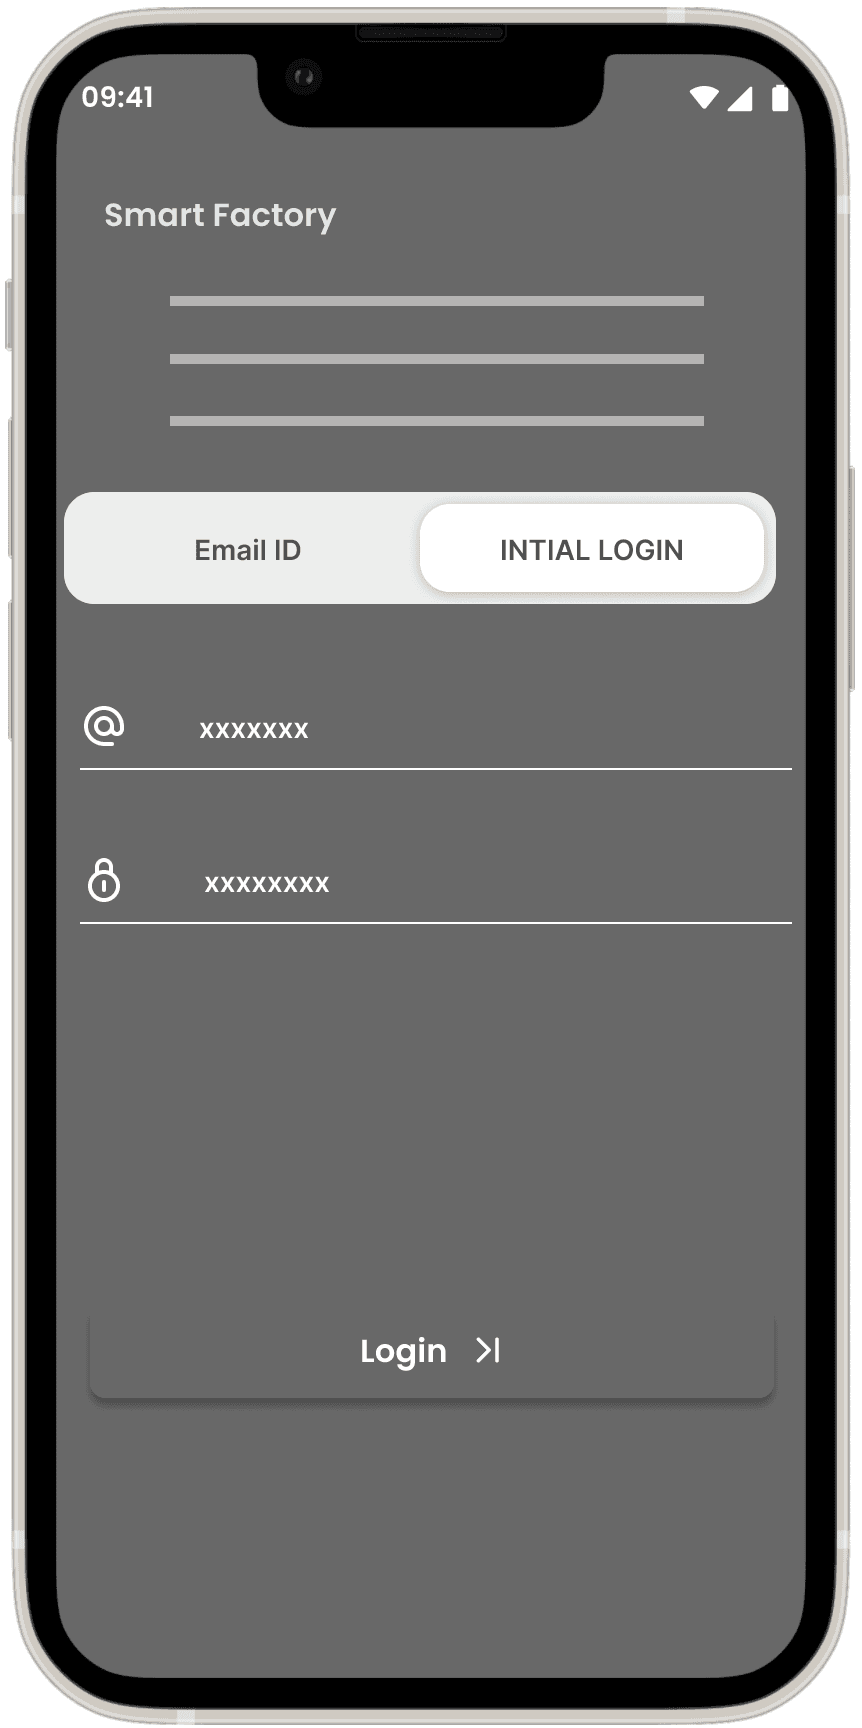
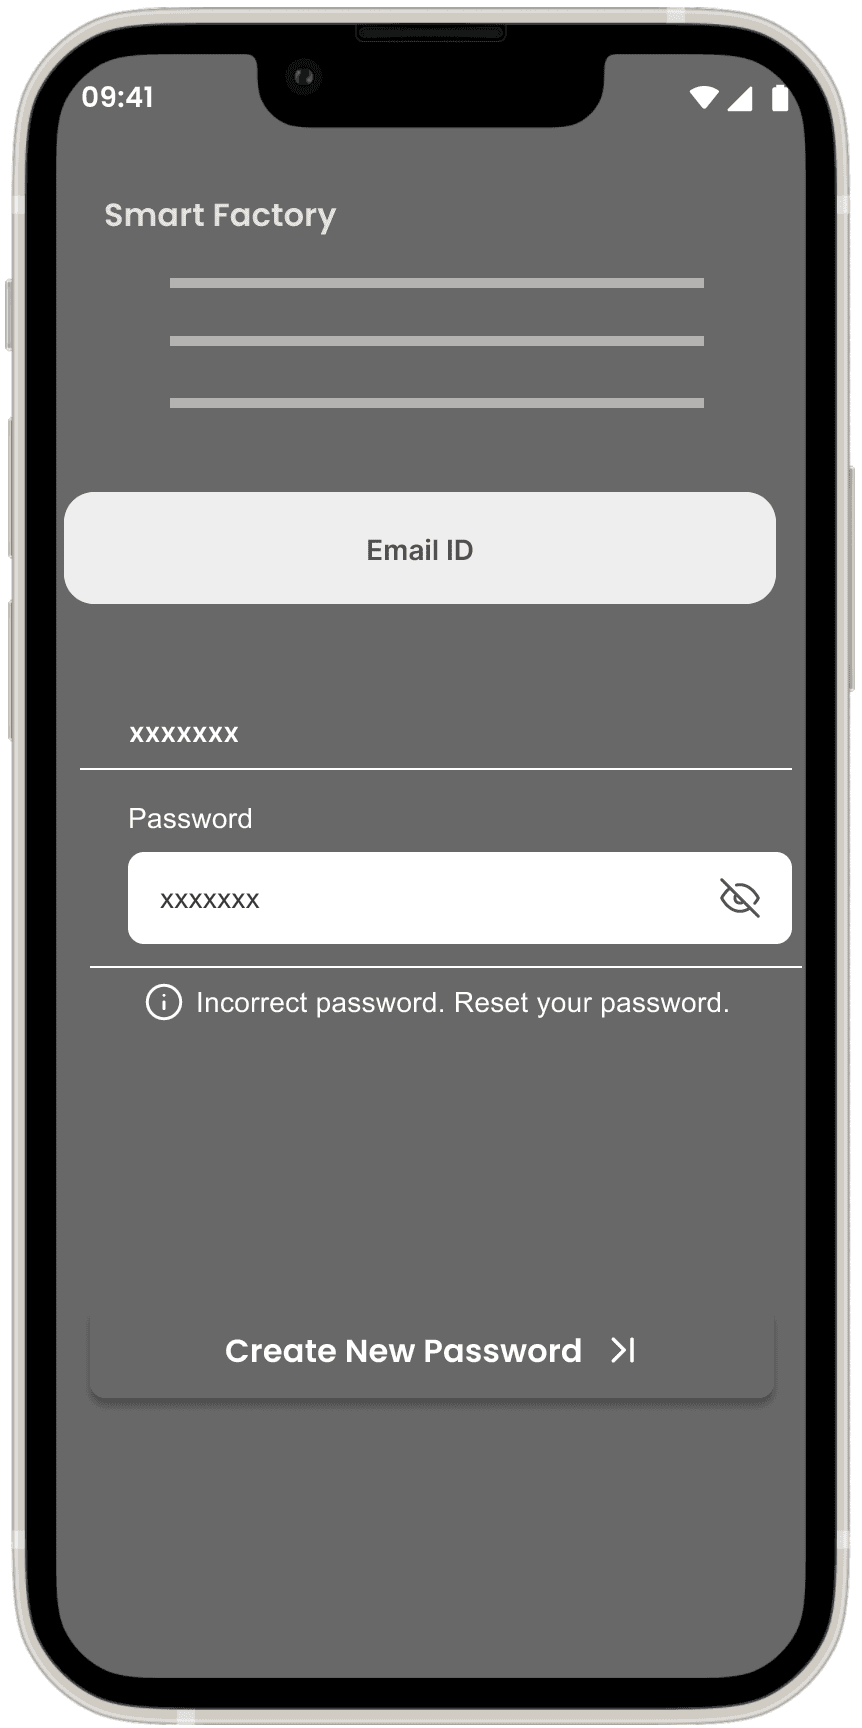
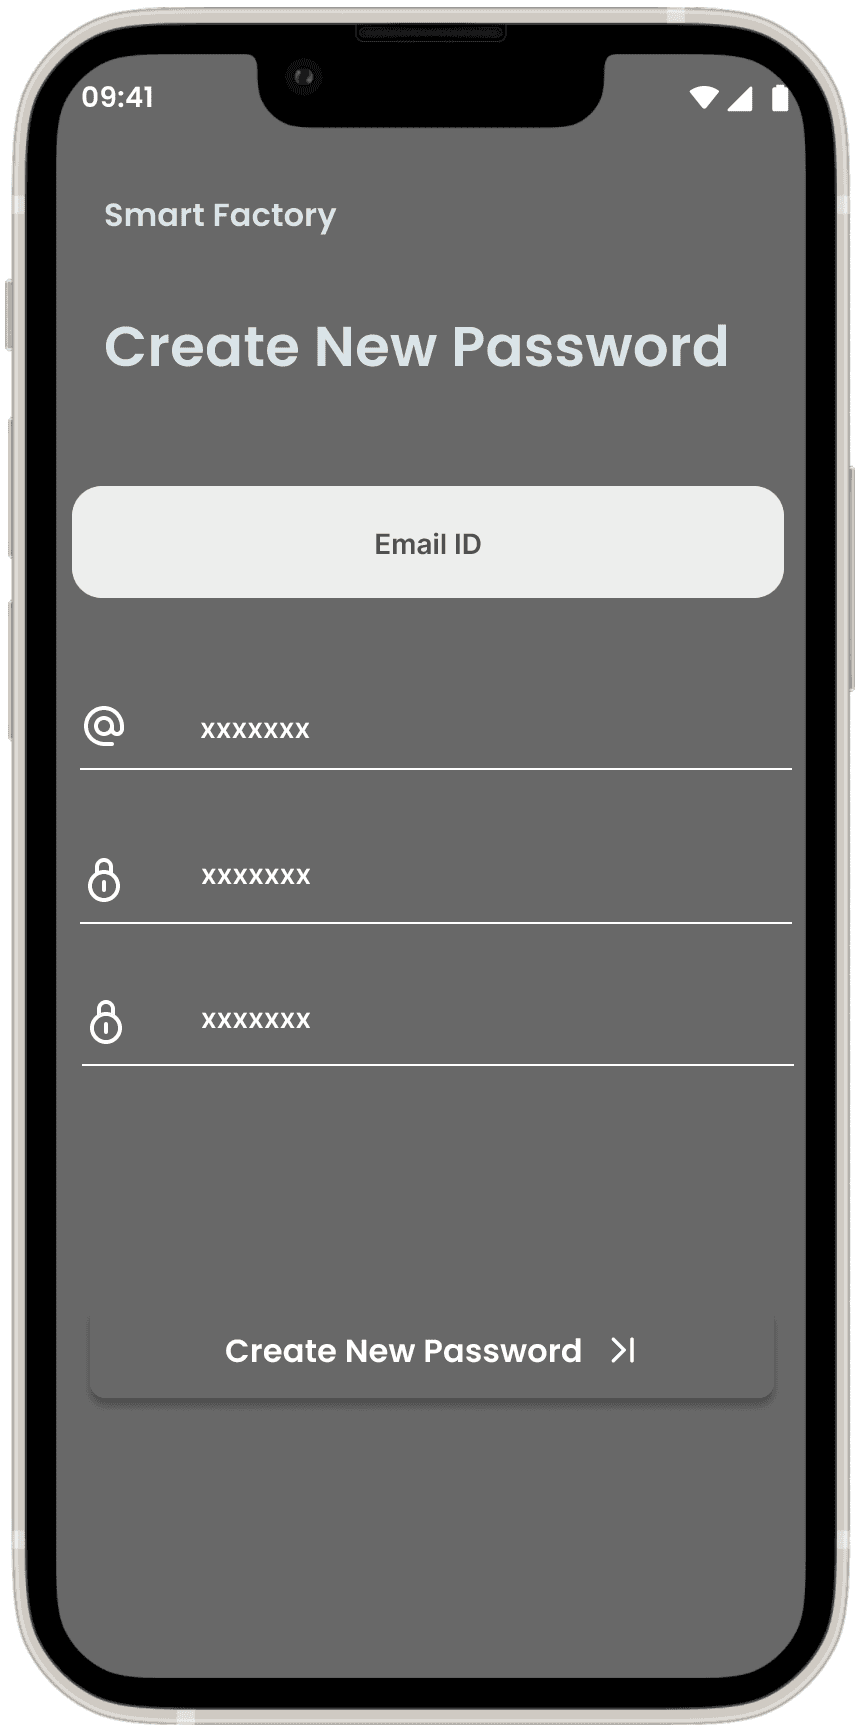
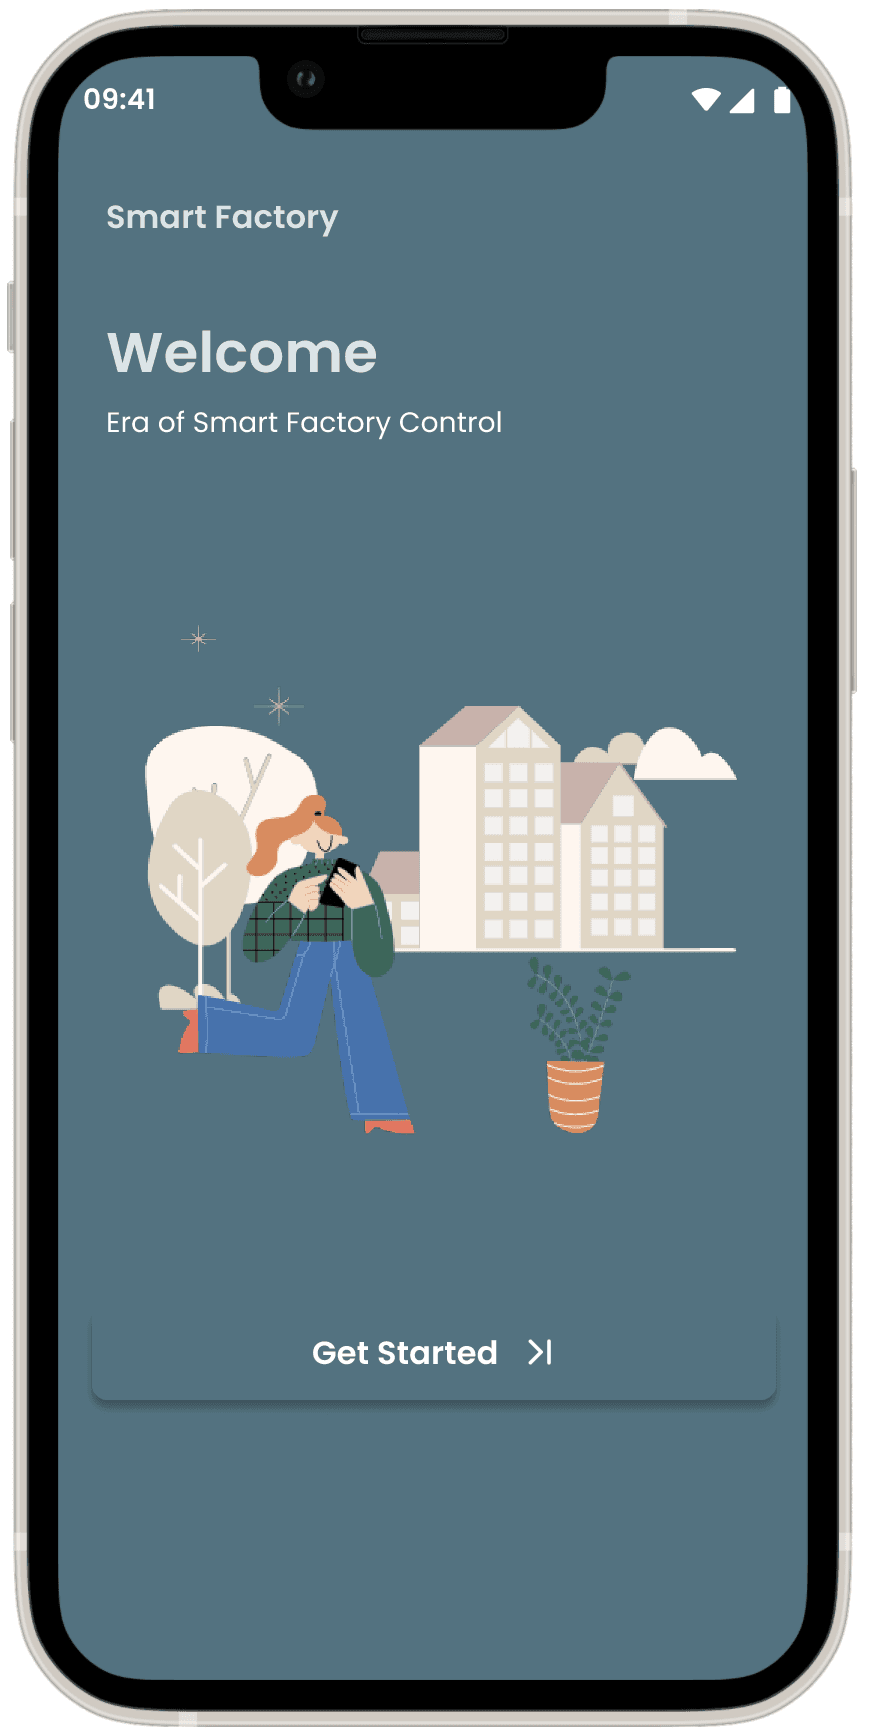
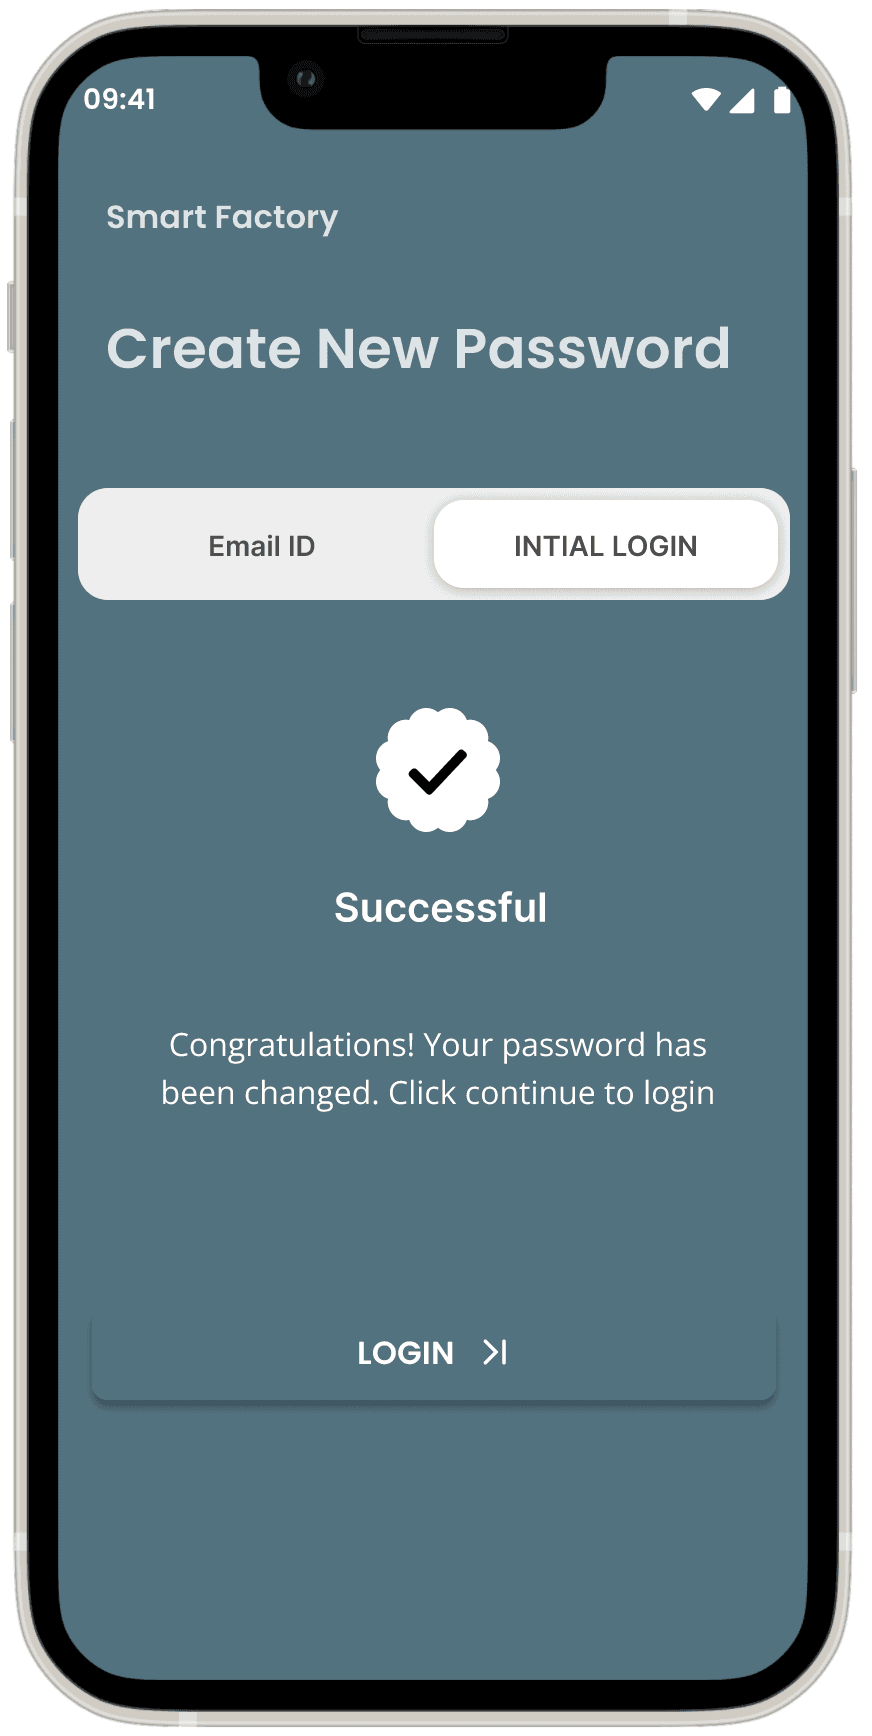
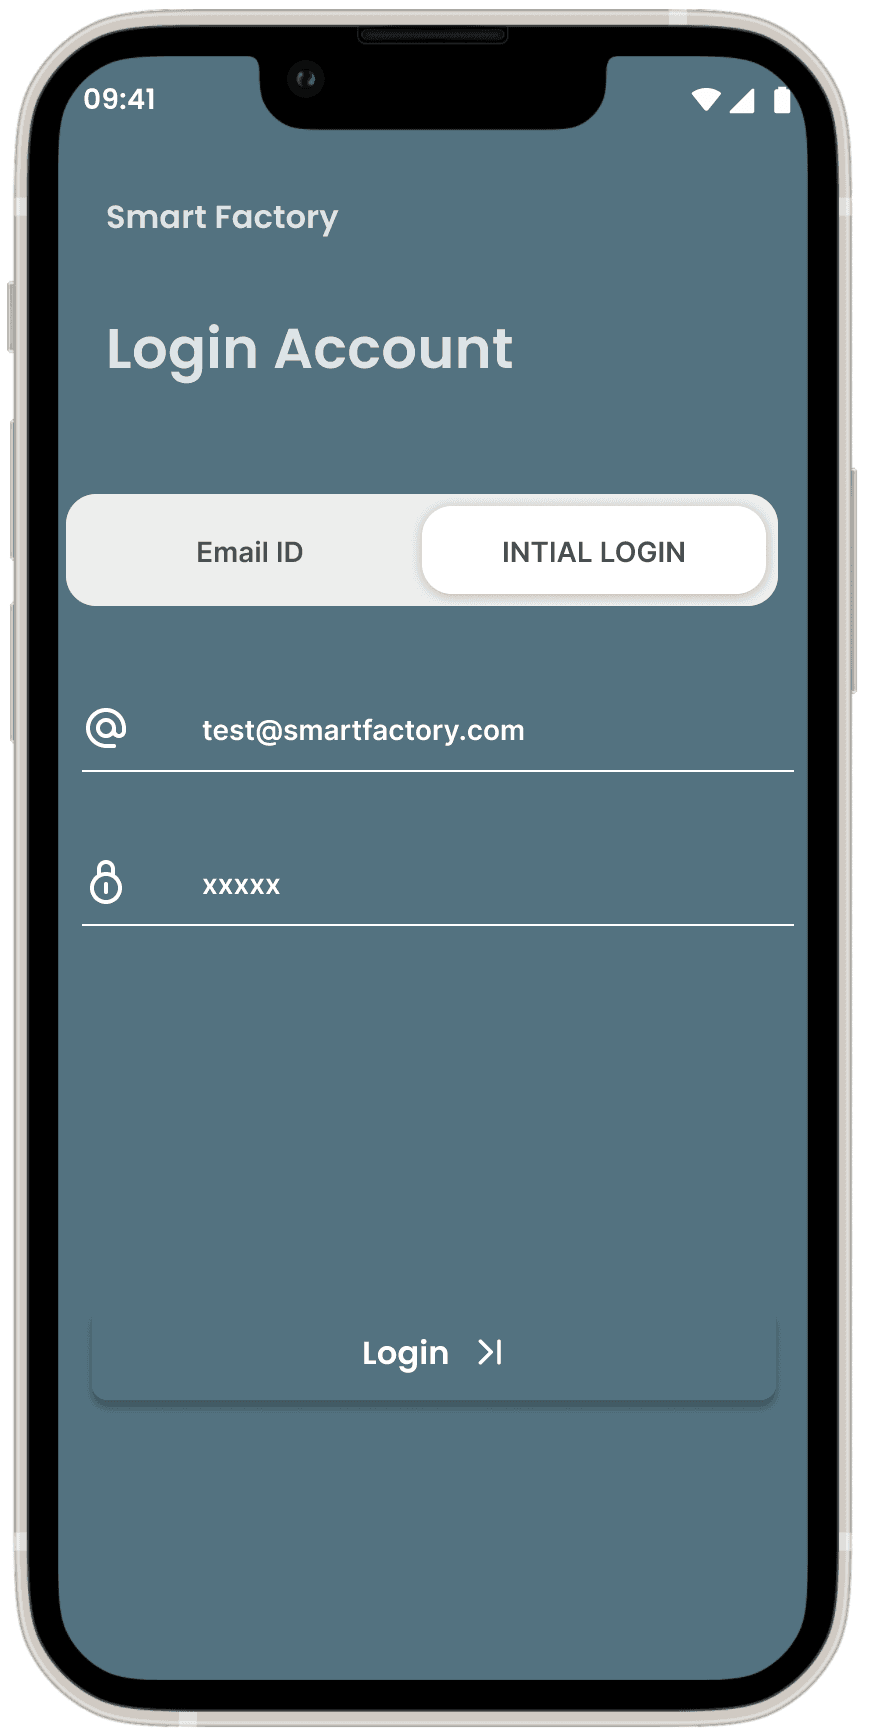
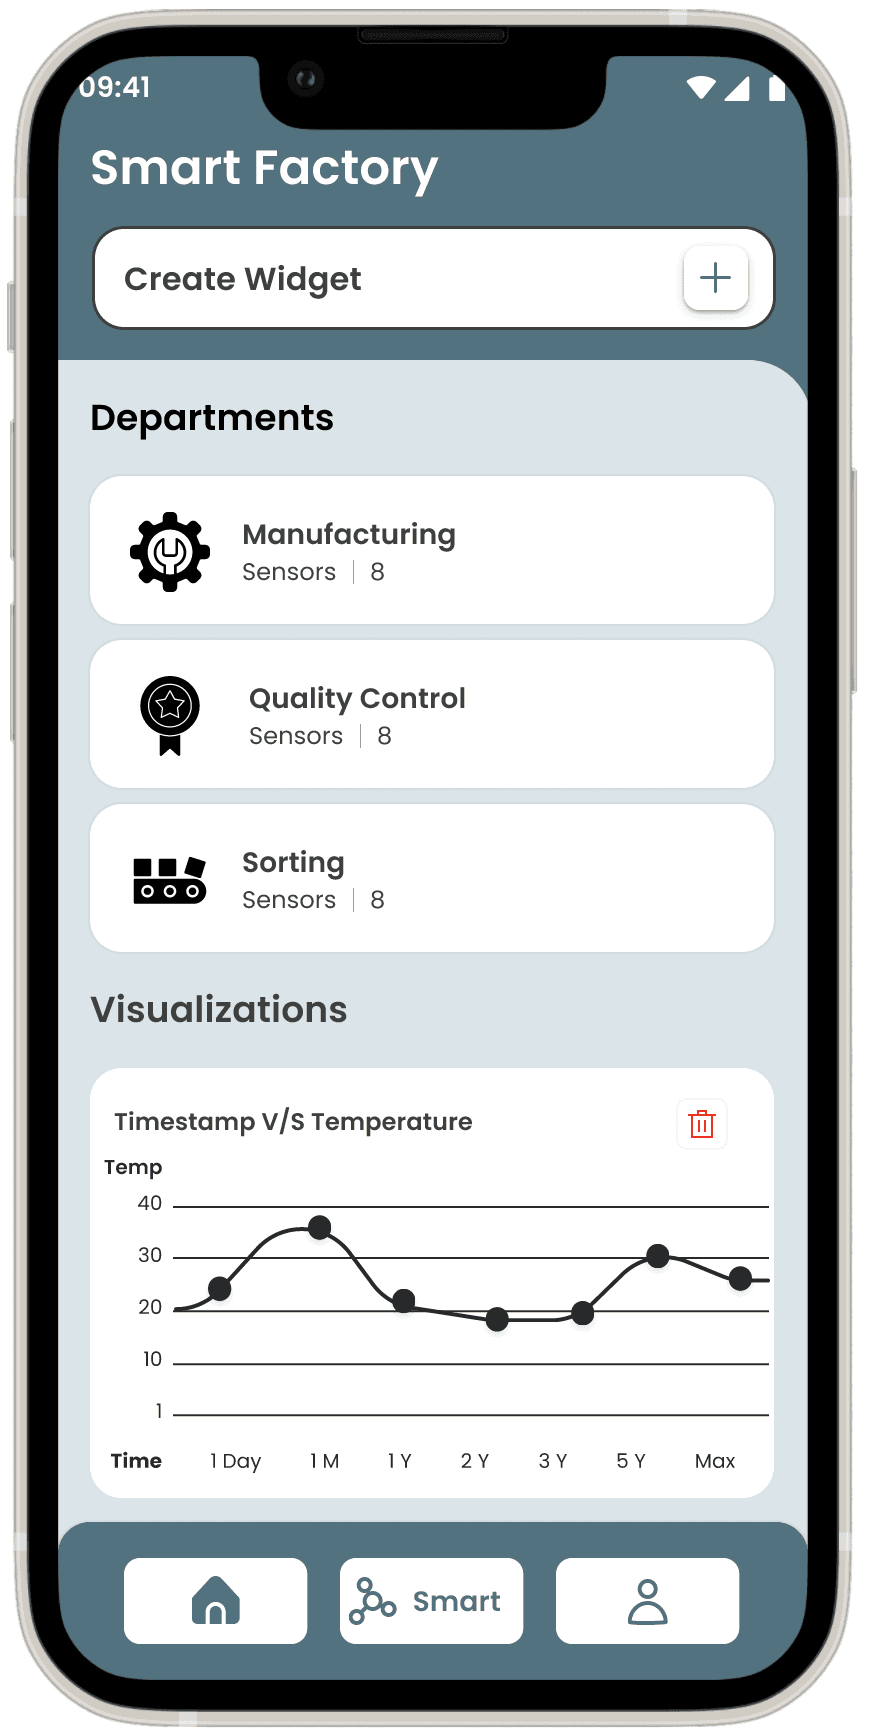
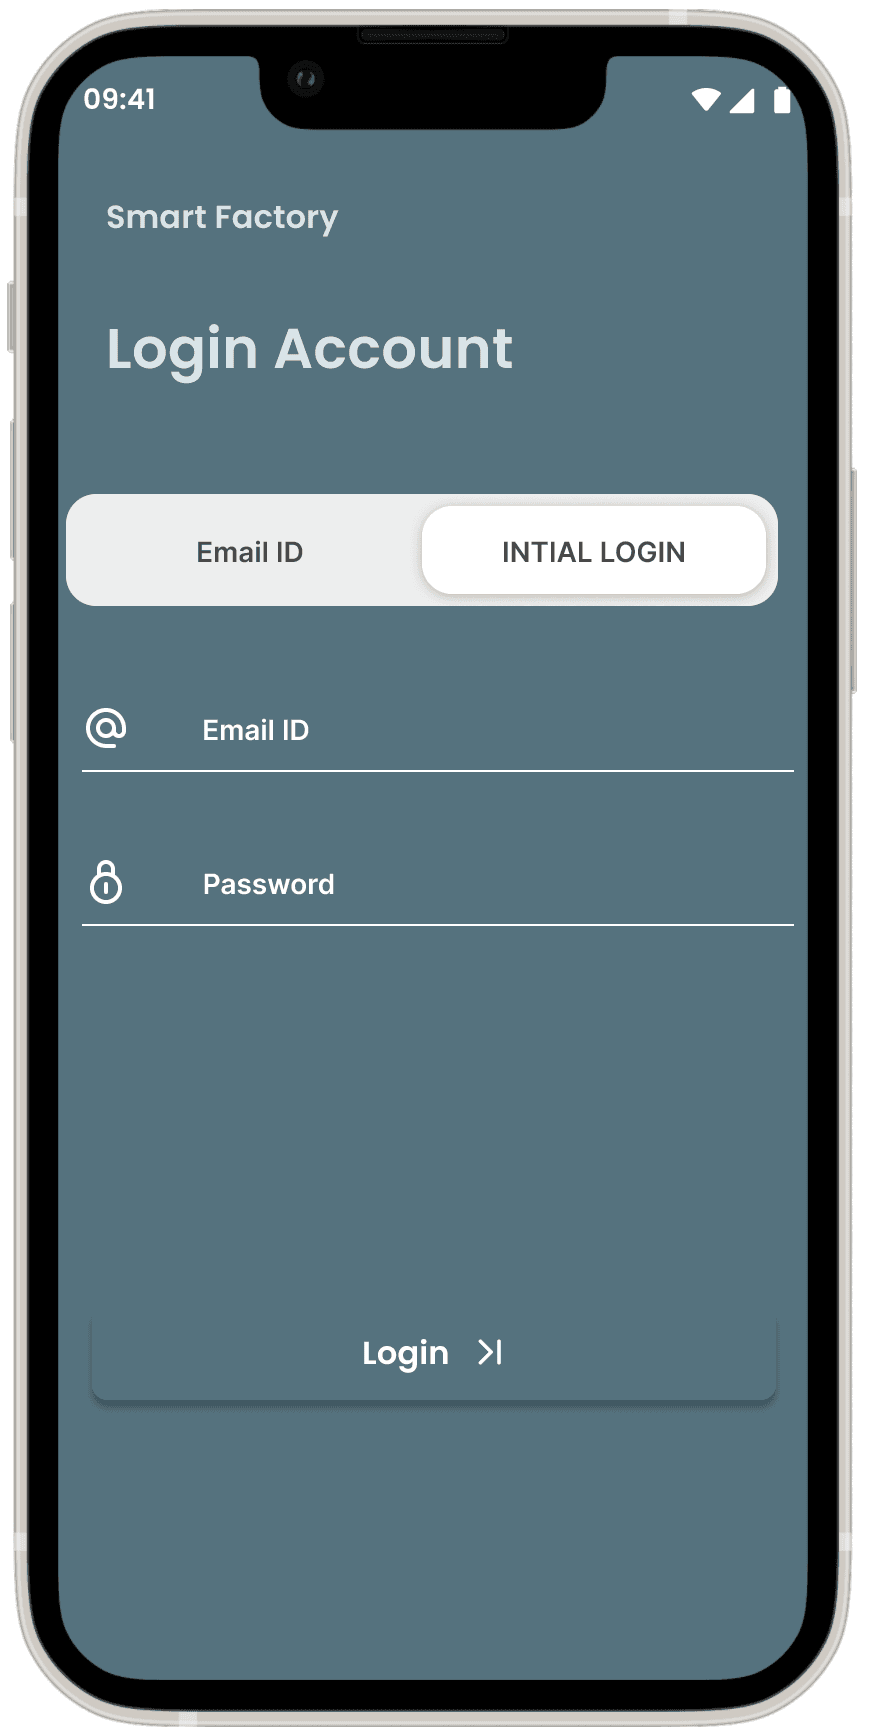
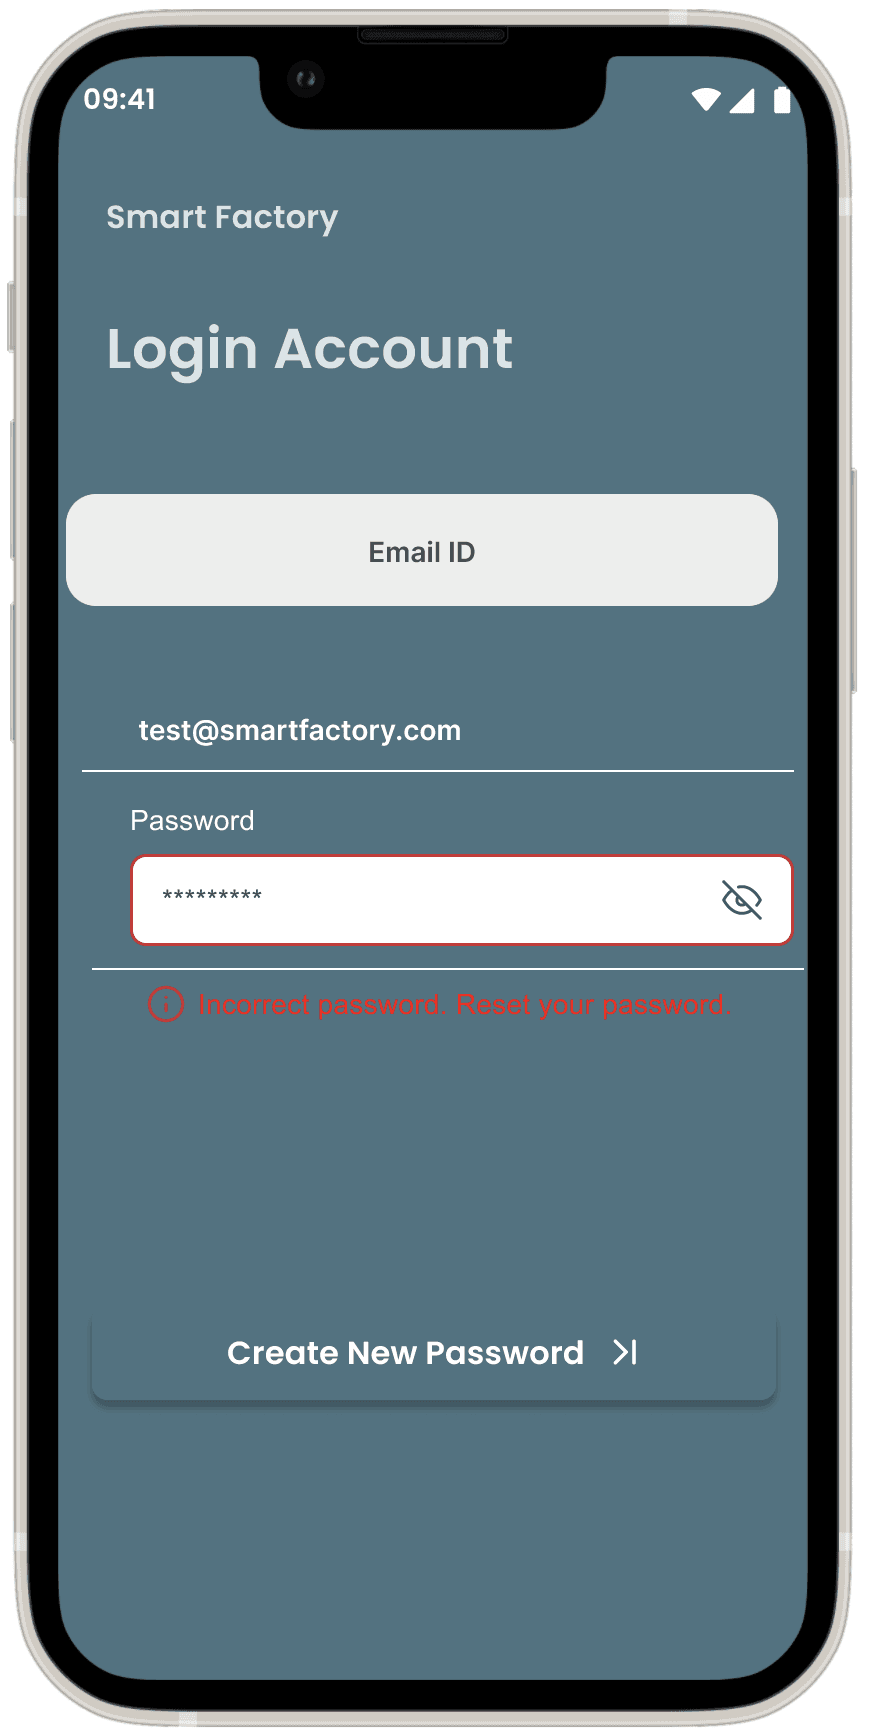
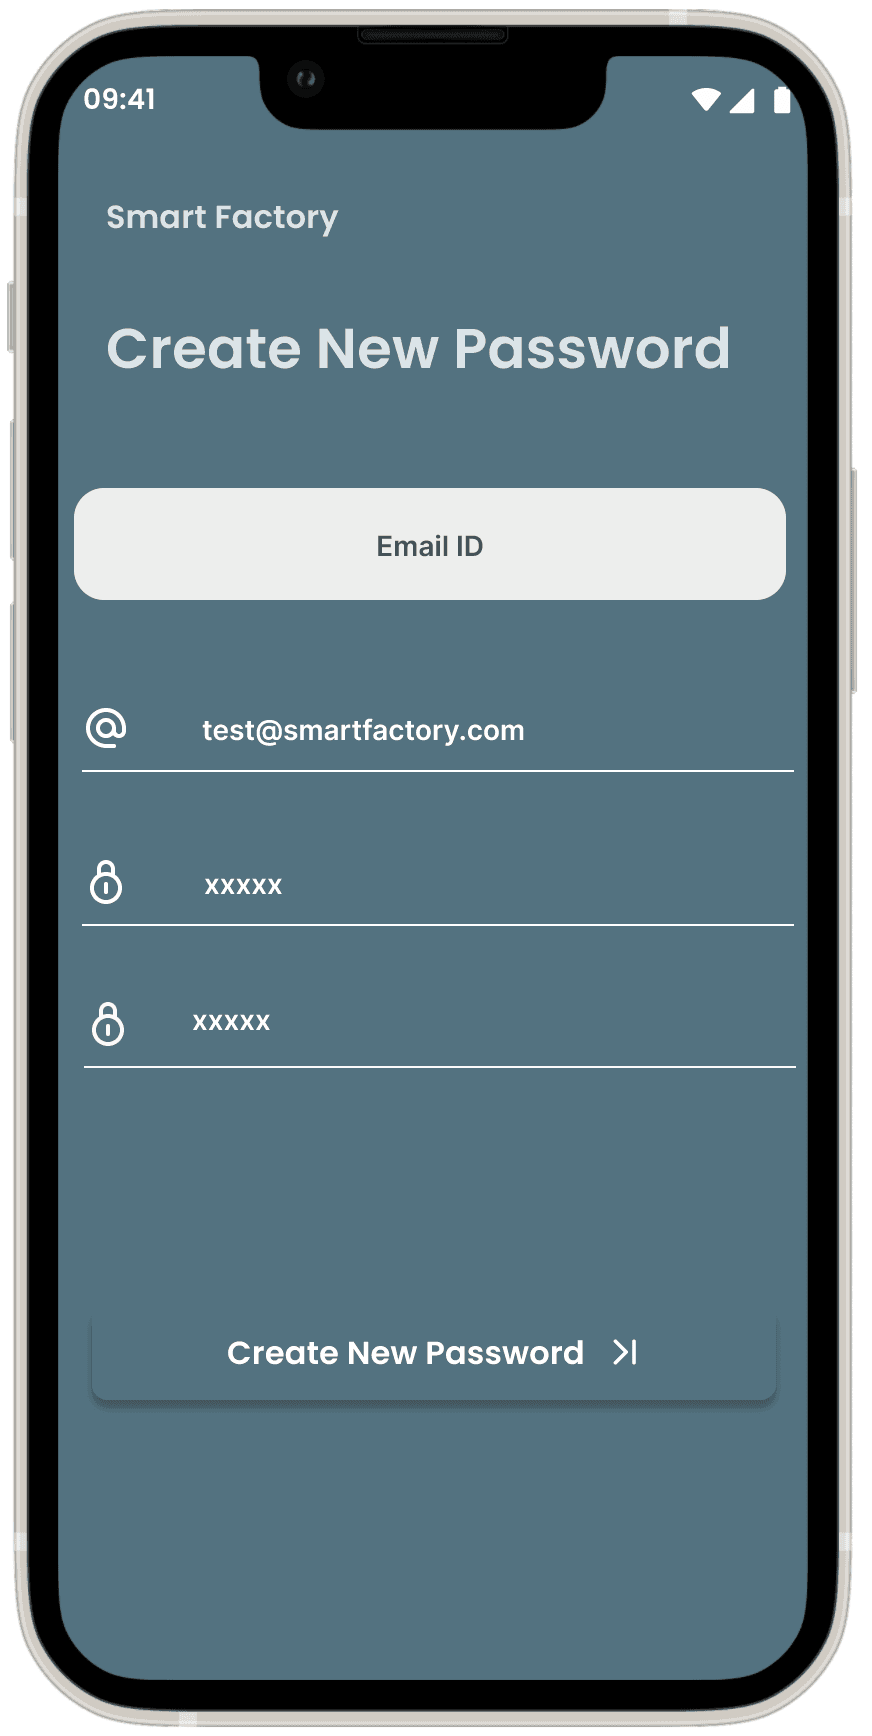
Login & Dashboard
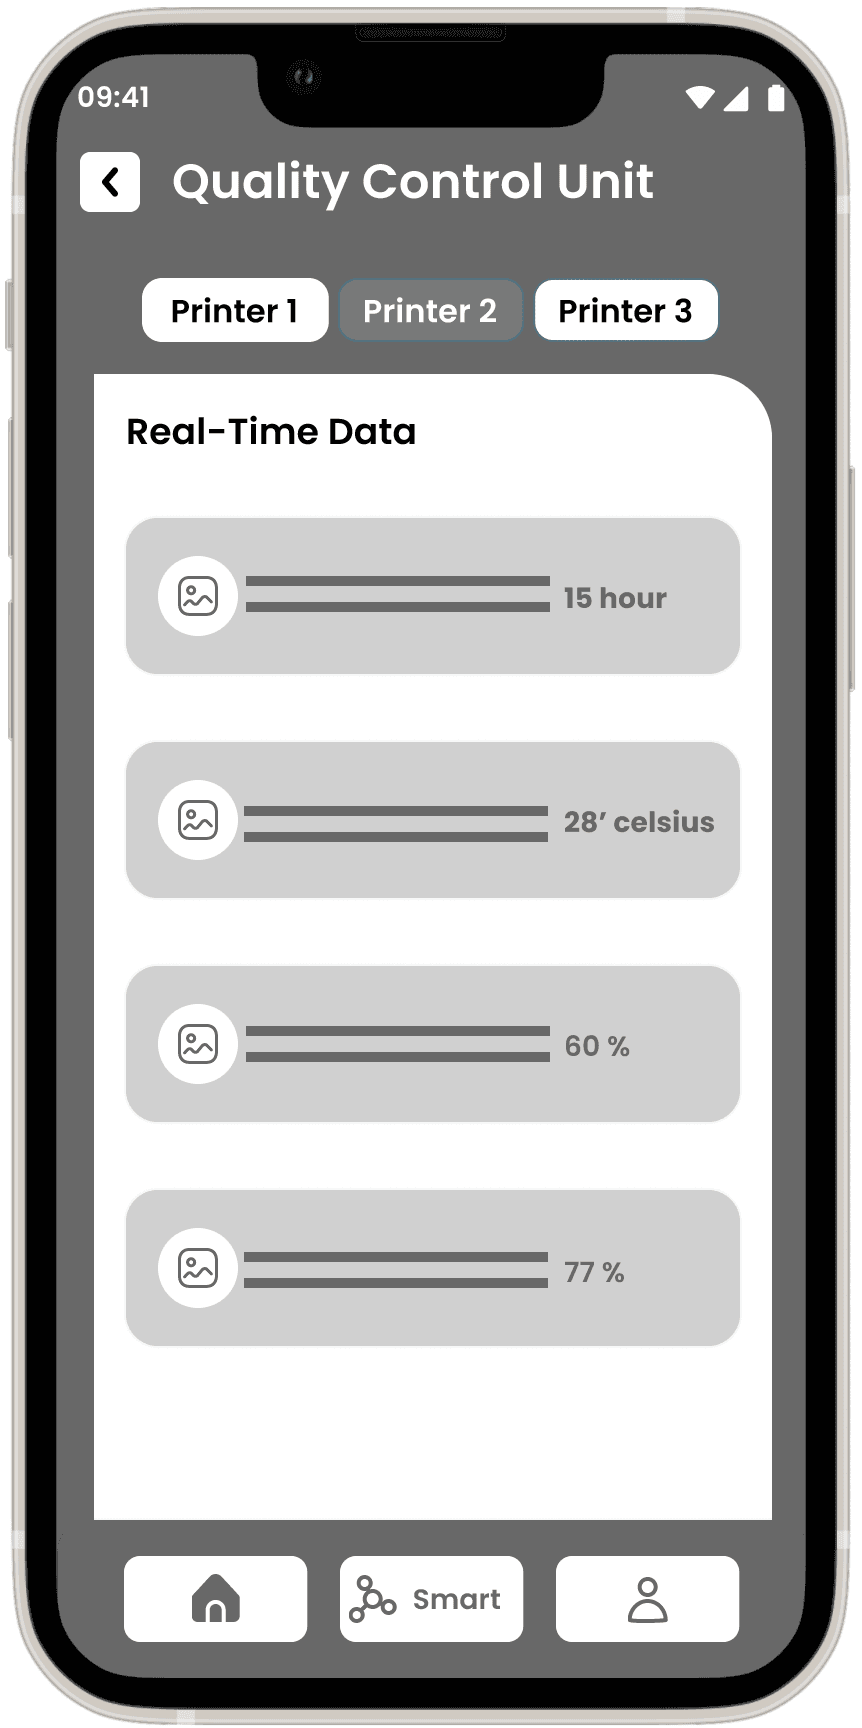
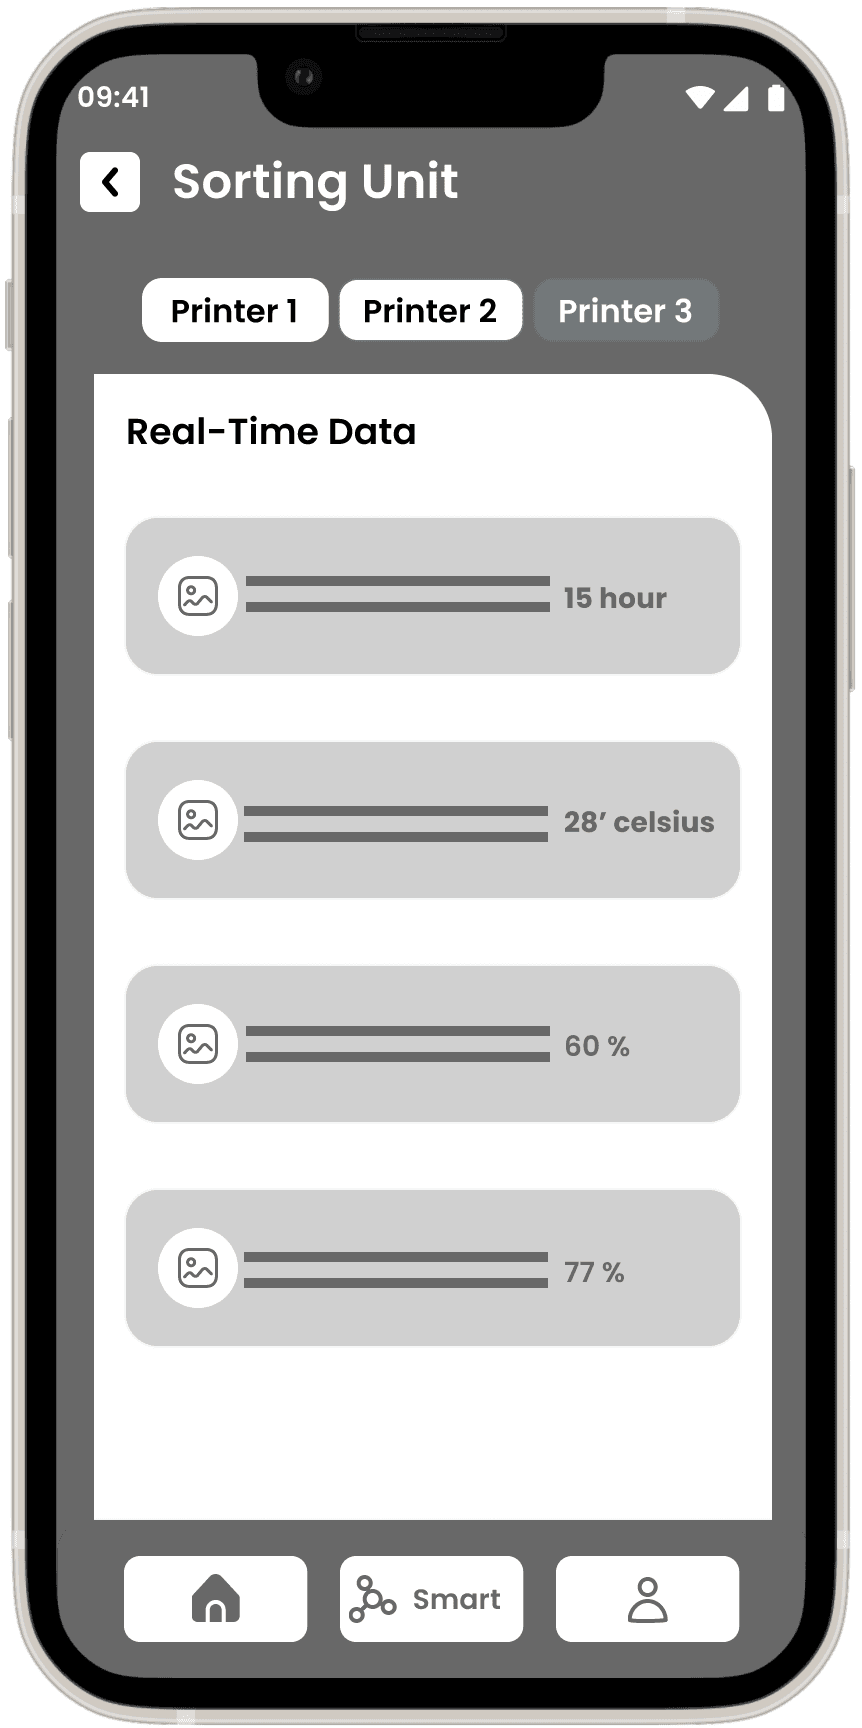
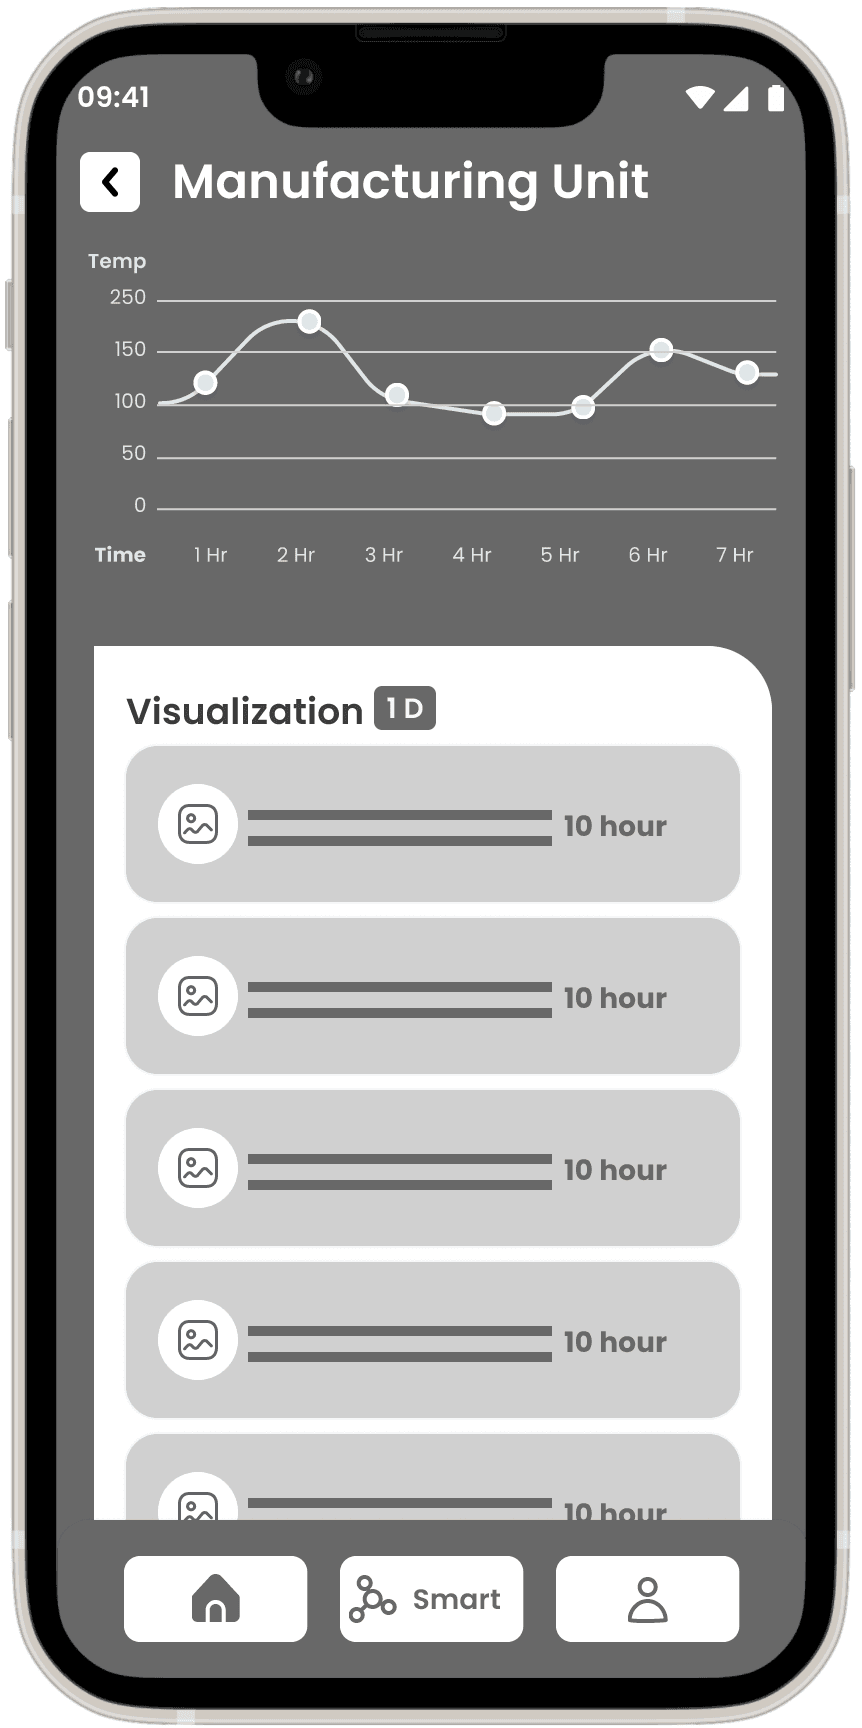
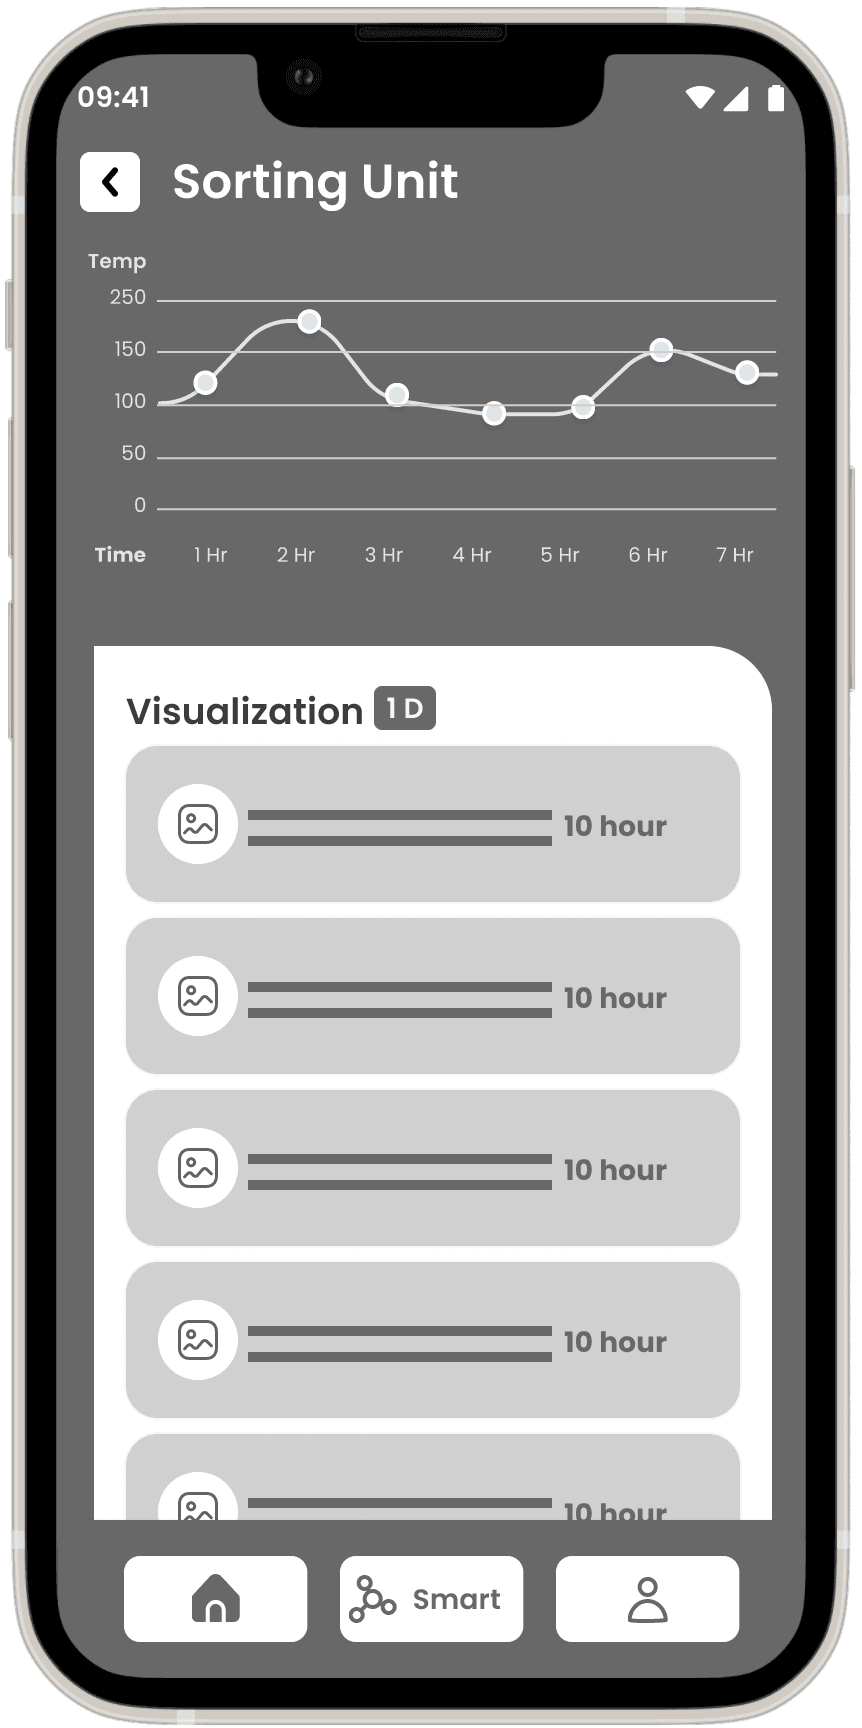
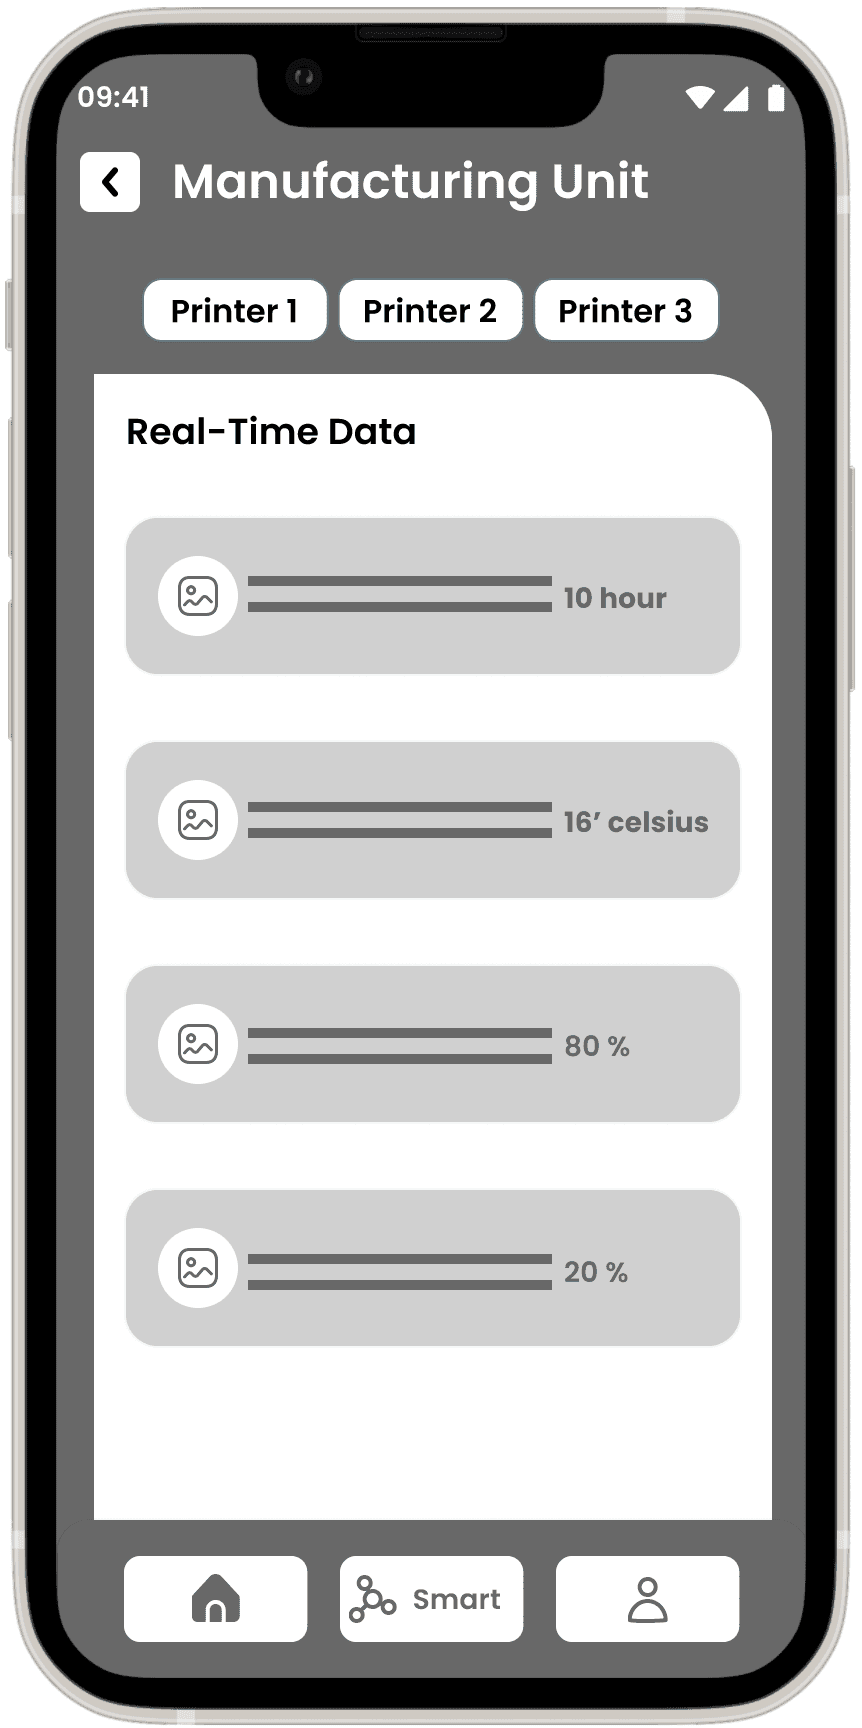
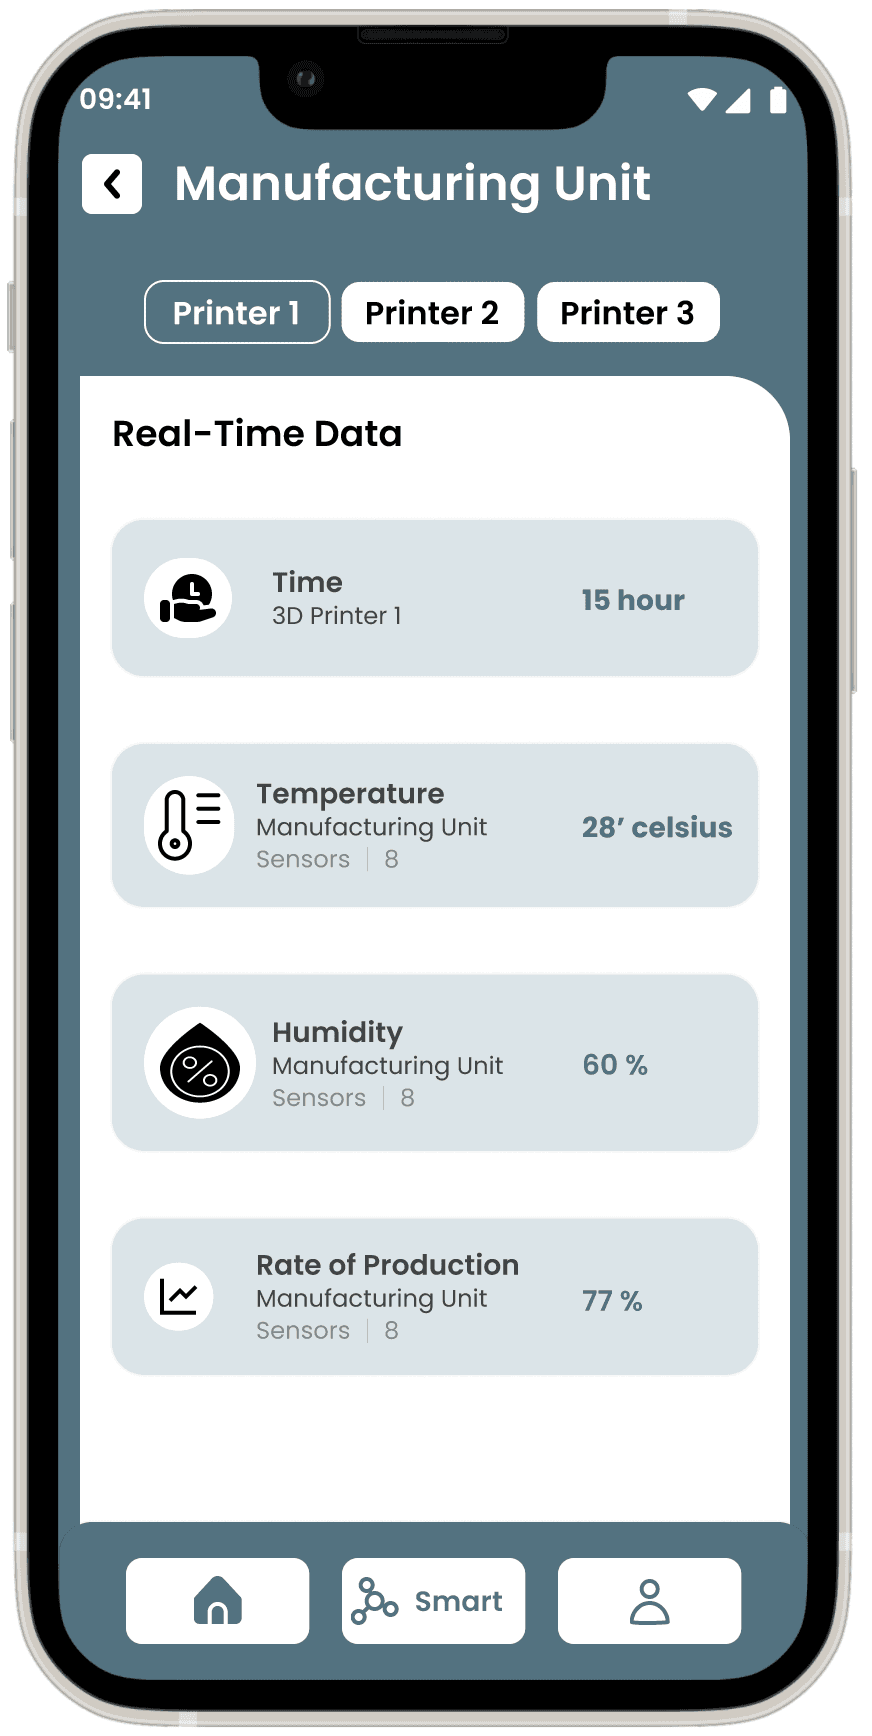
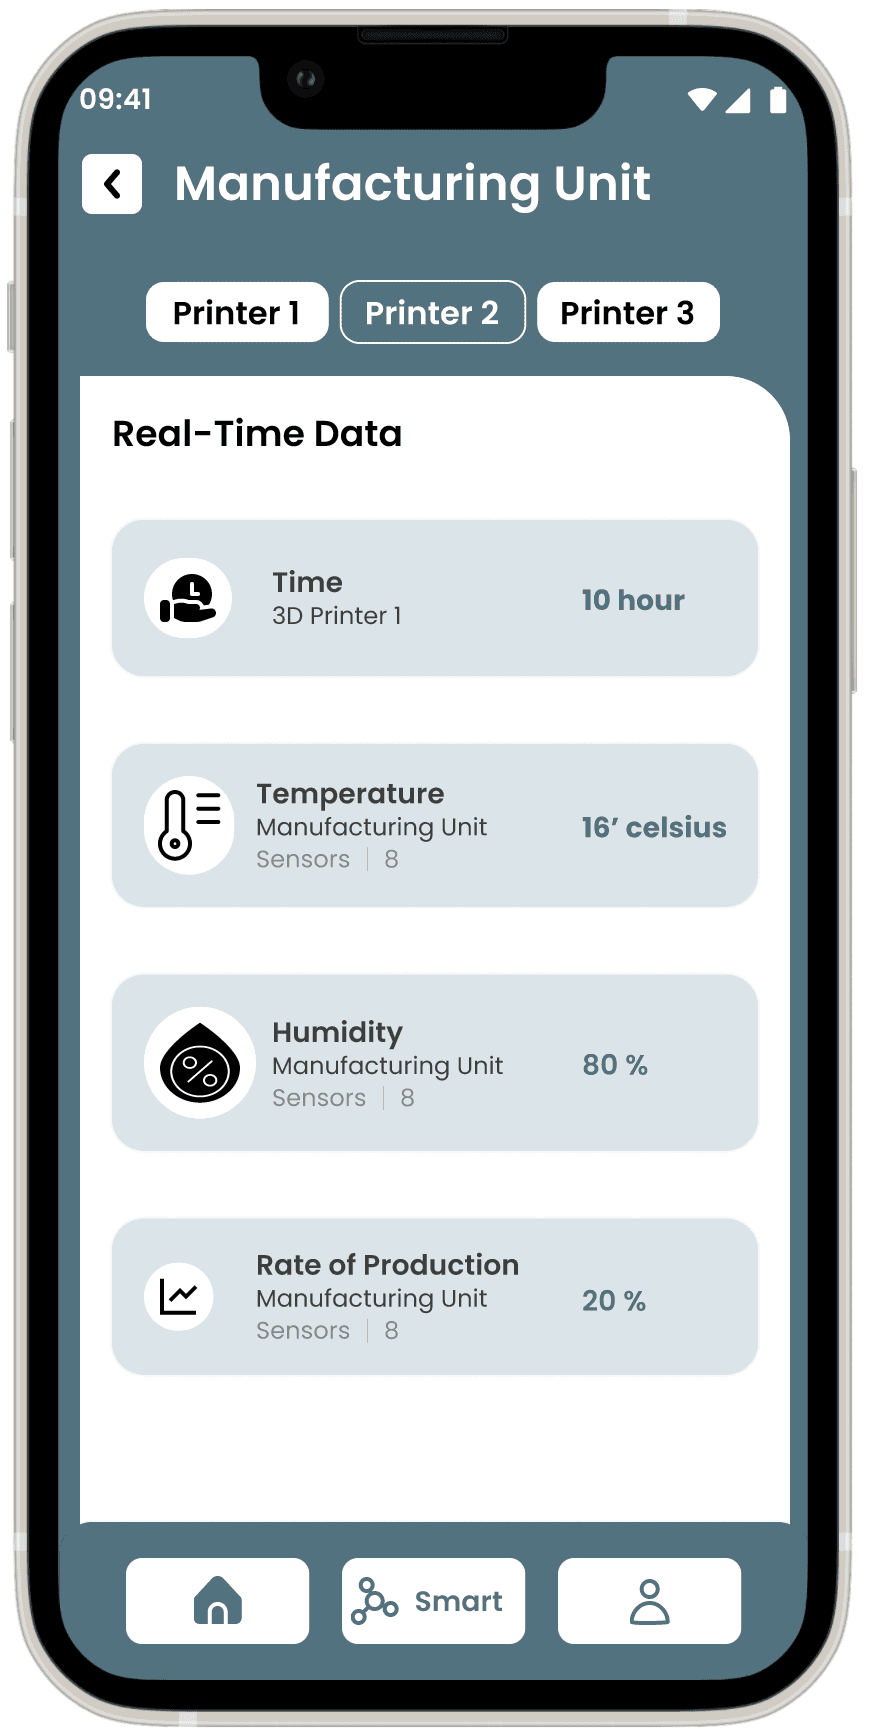
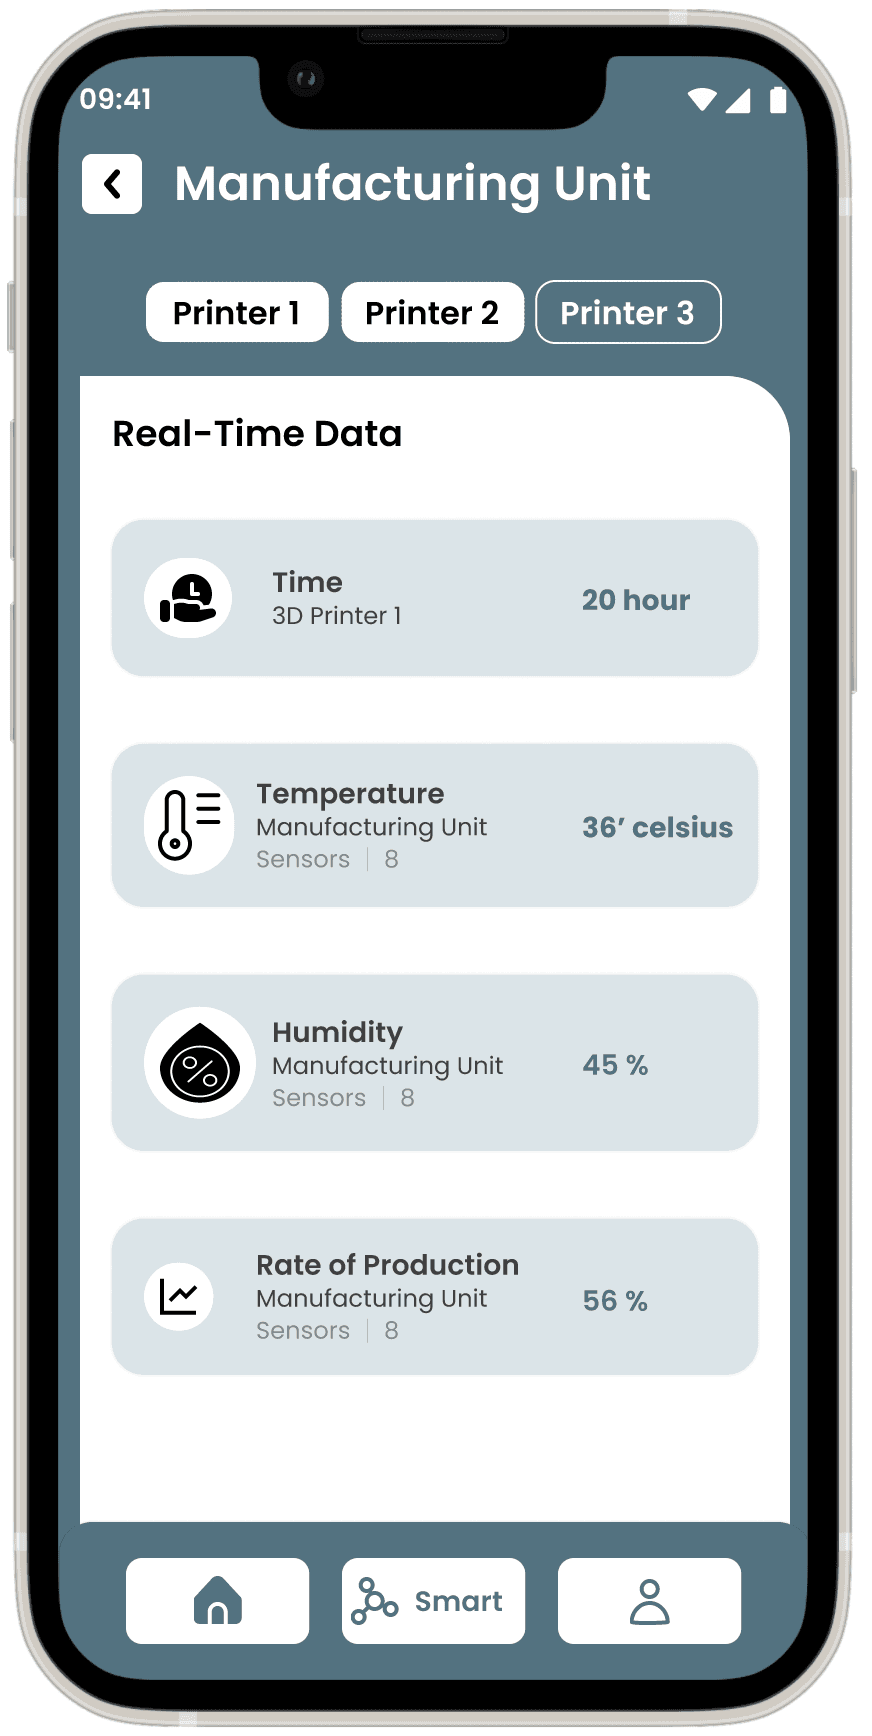
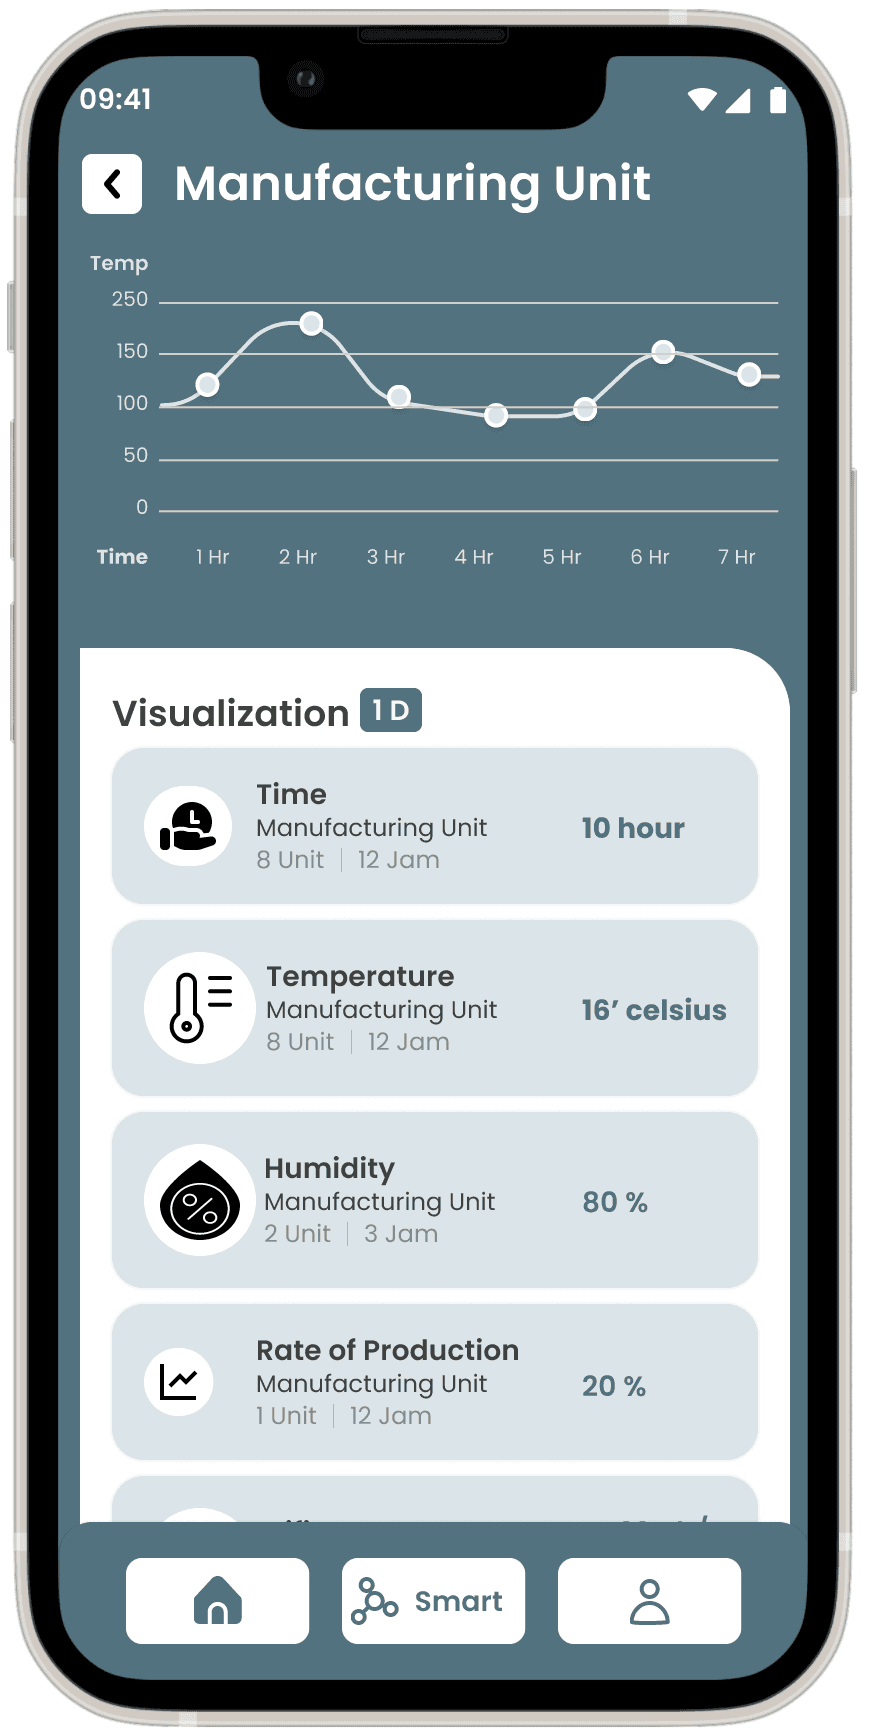
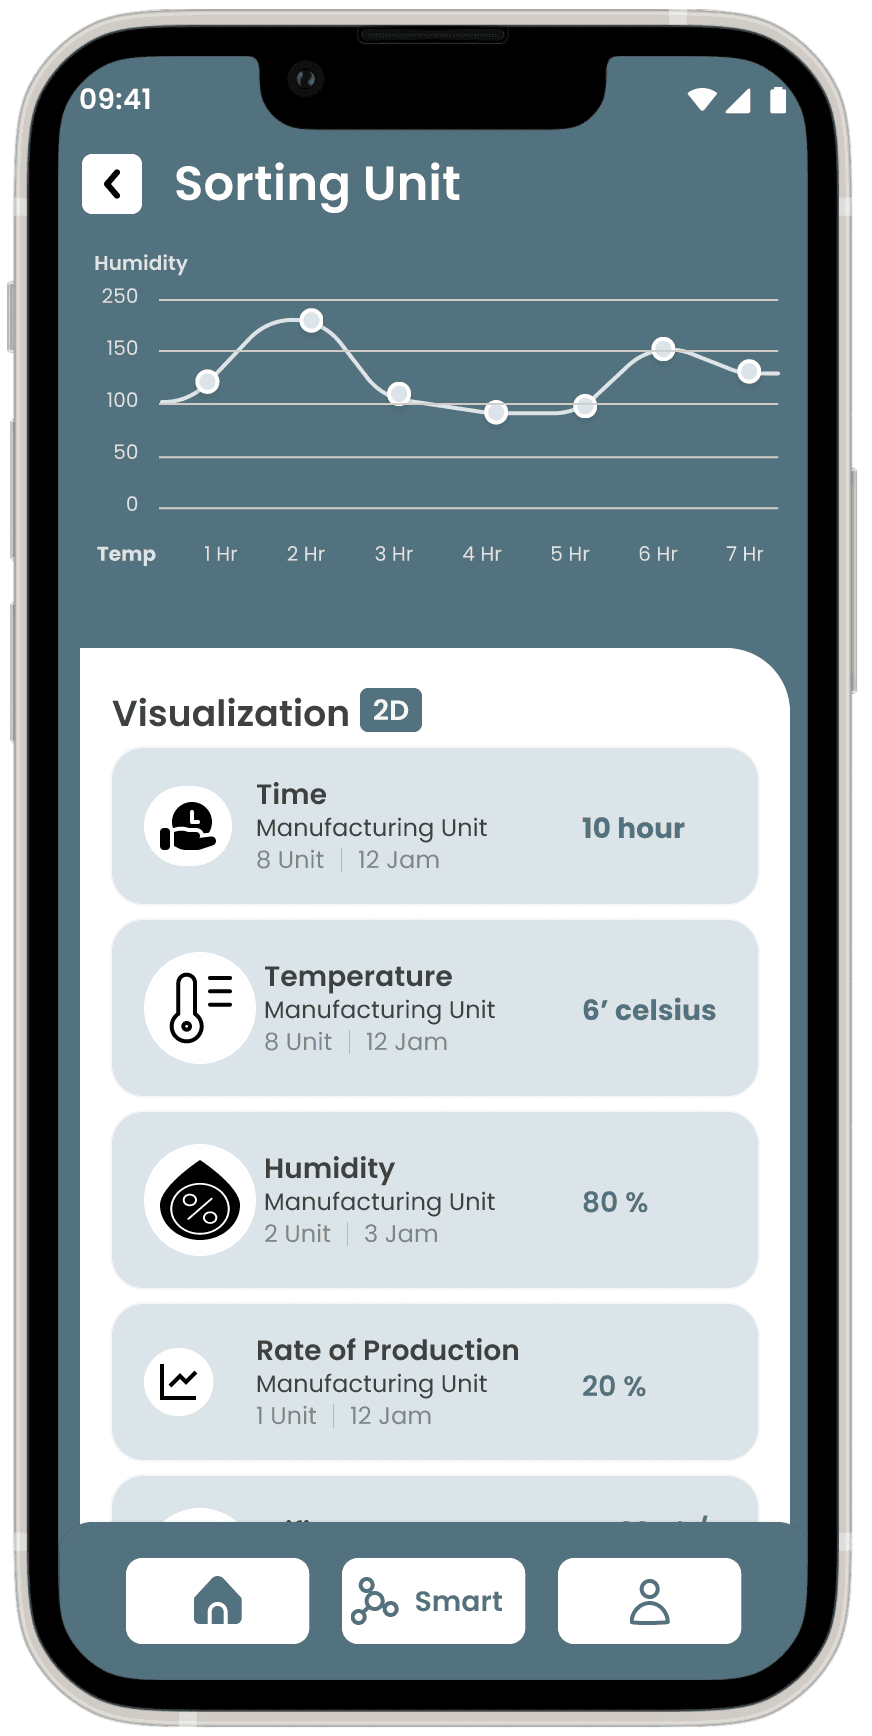
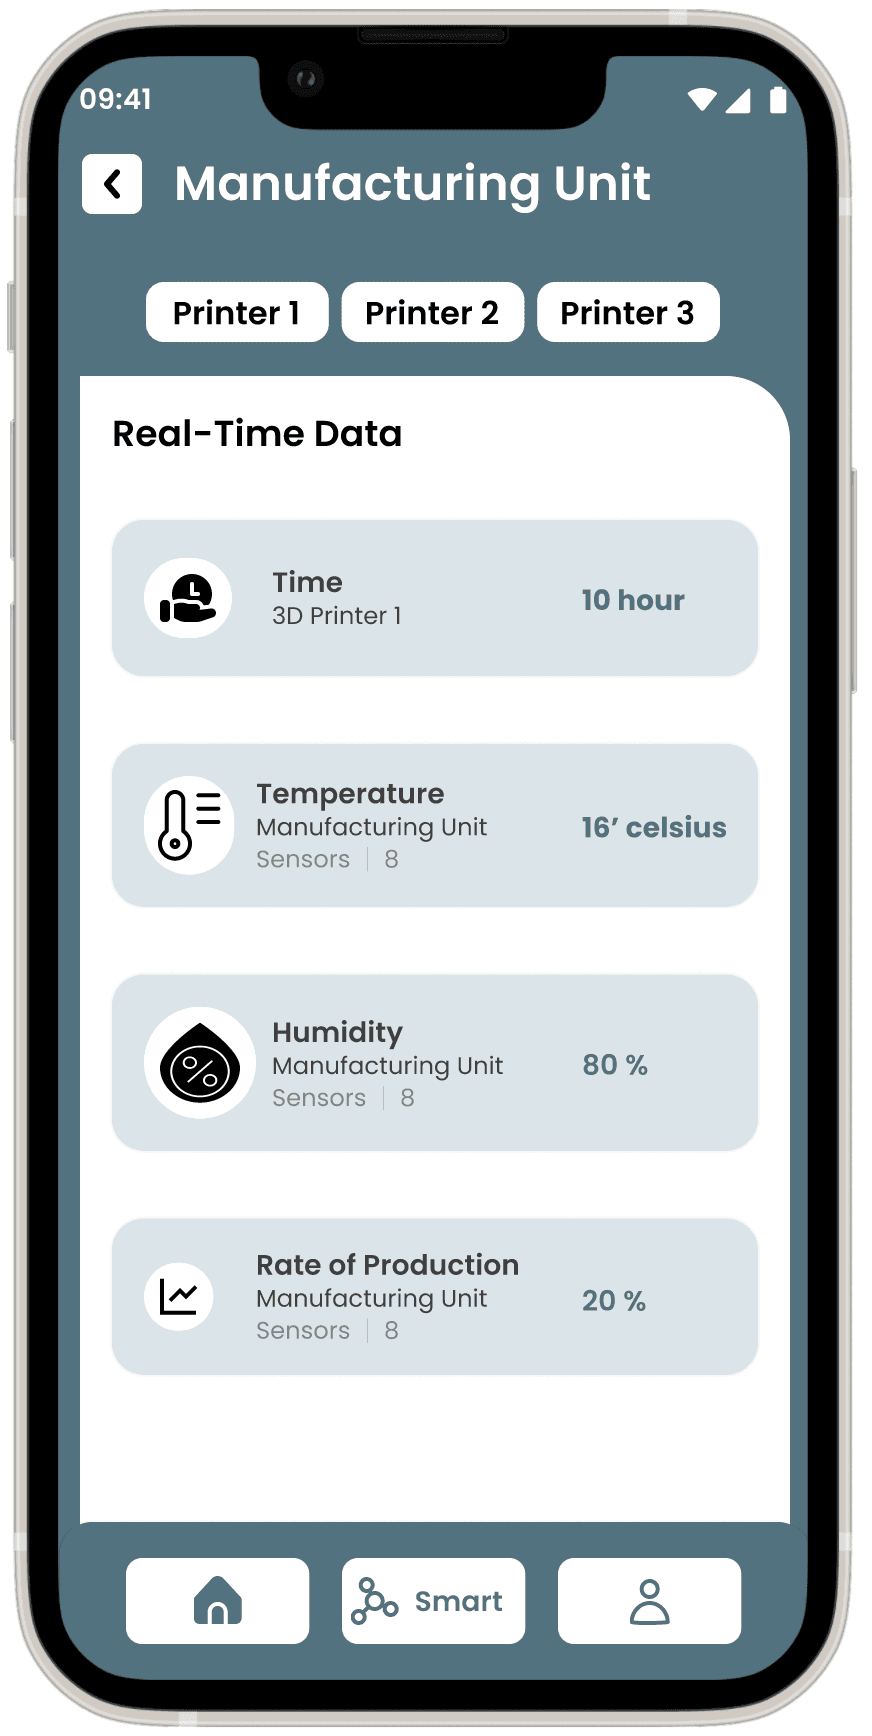
Real-Time Data Visualizations
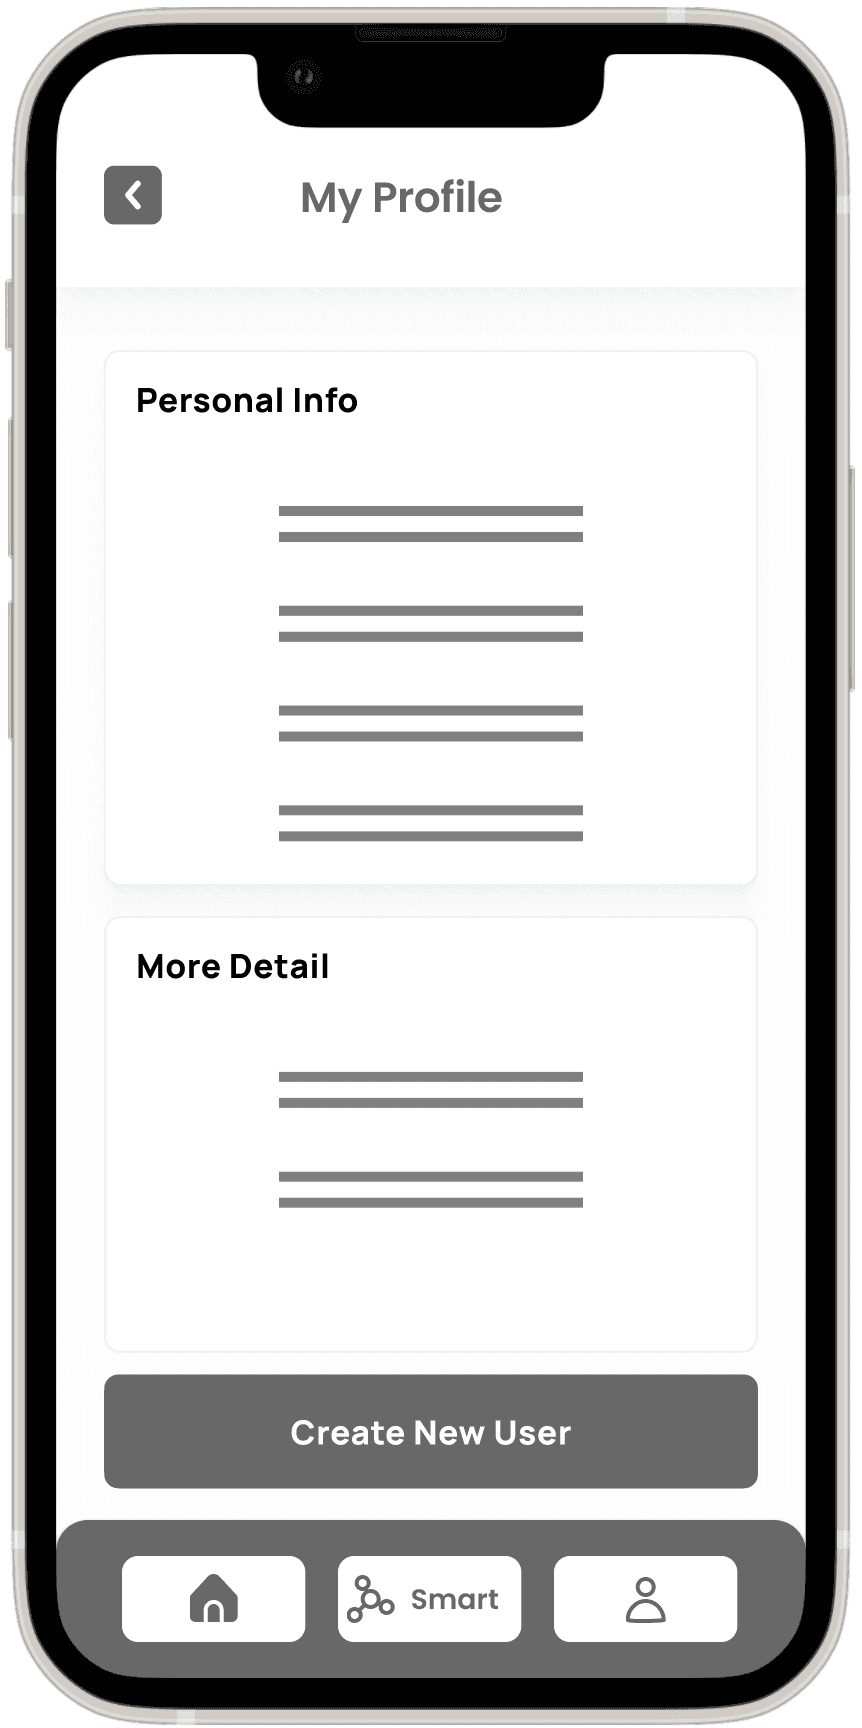
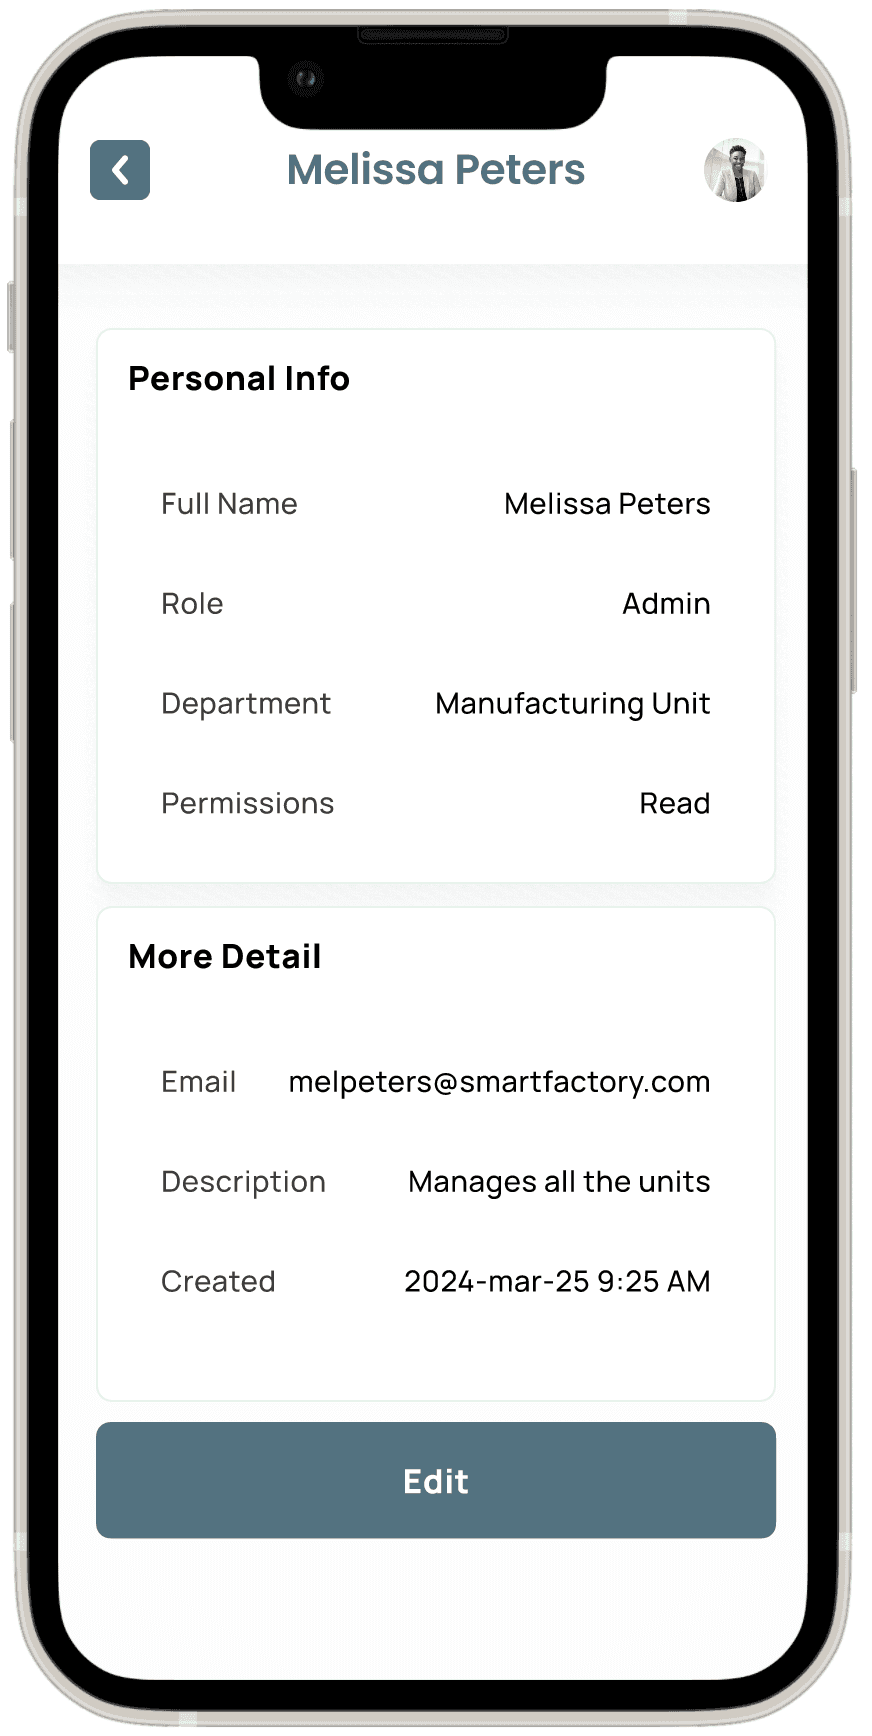
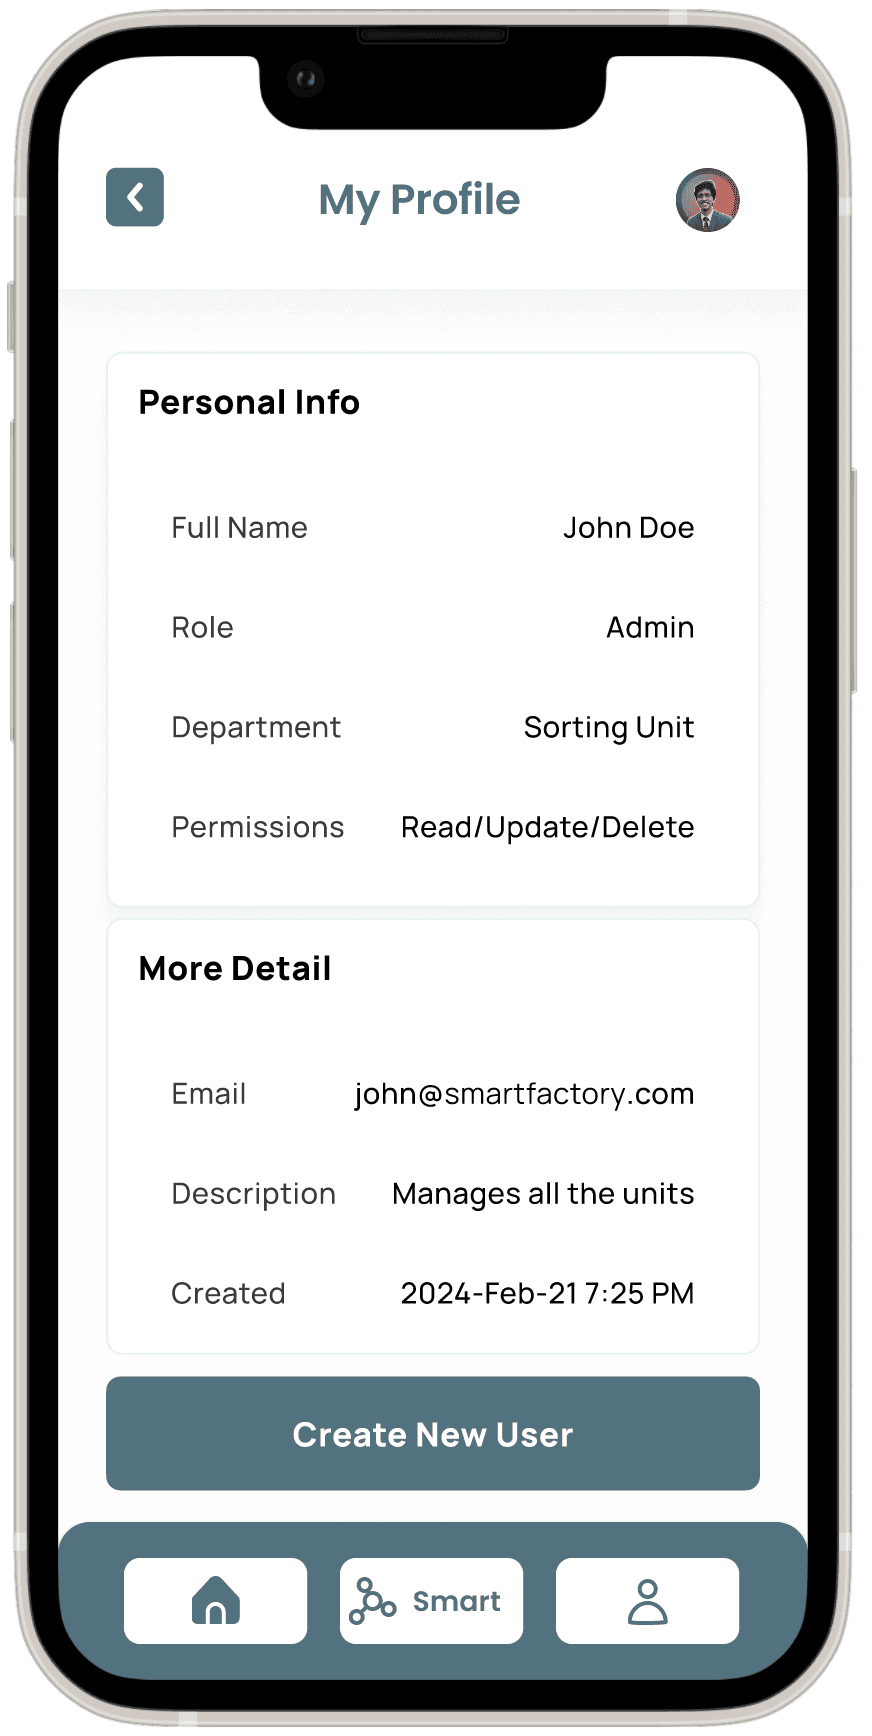
User Management & Permissions
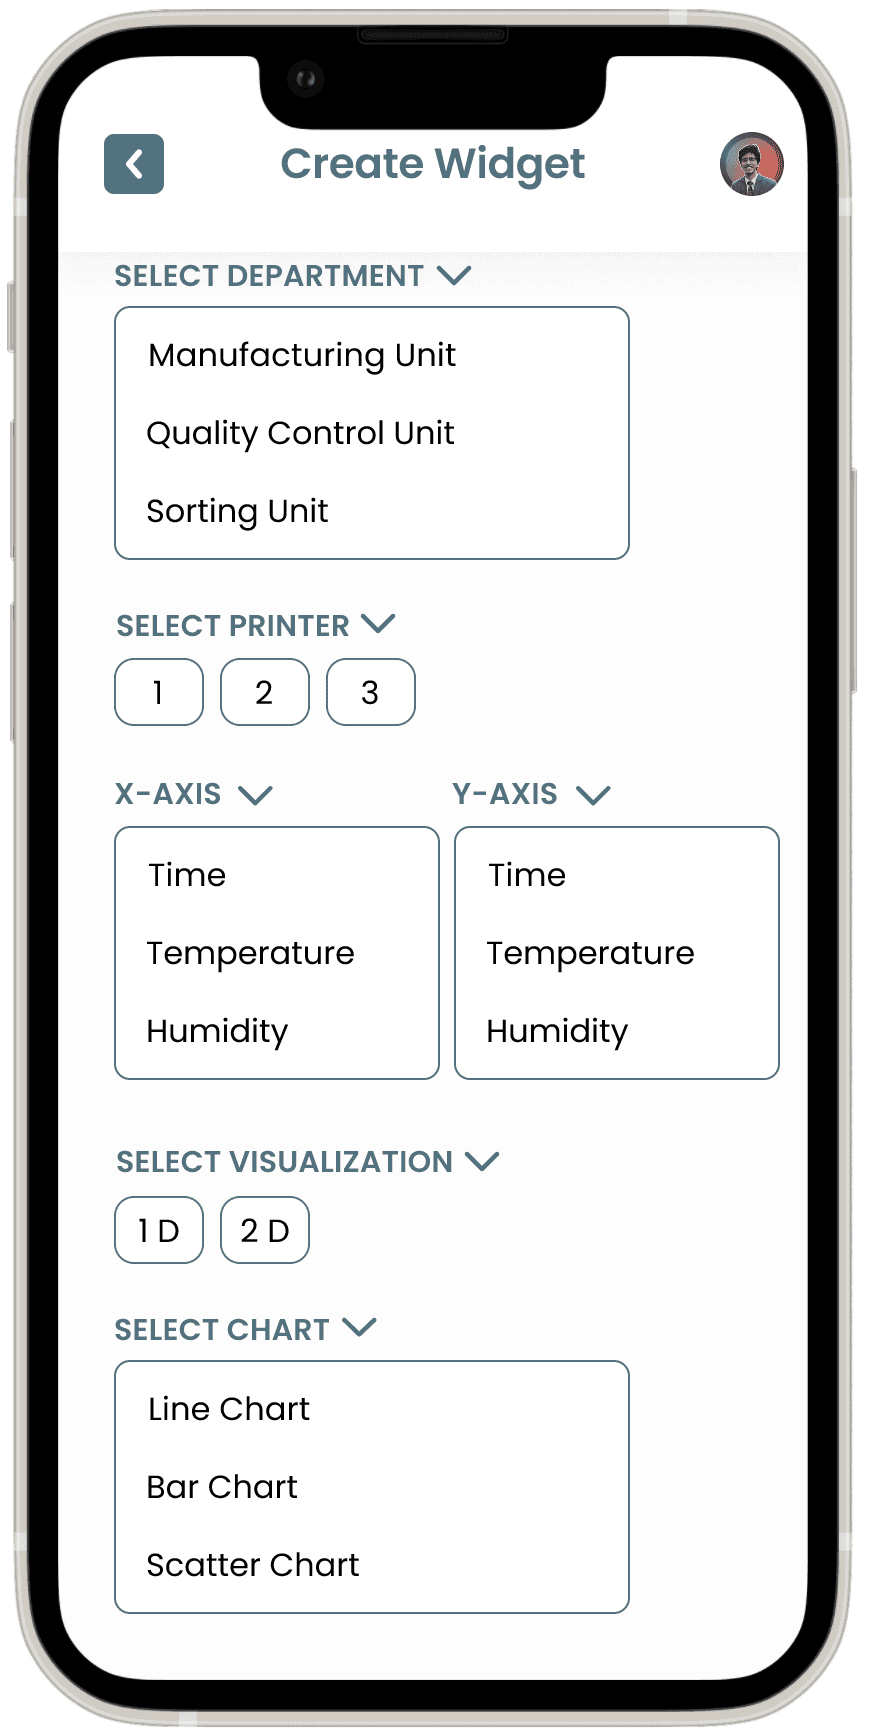
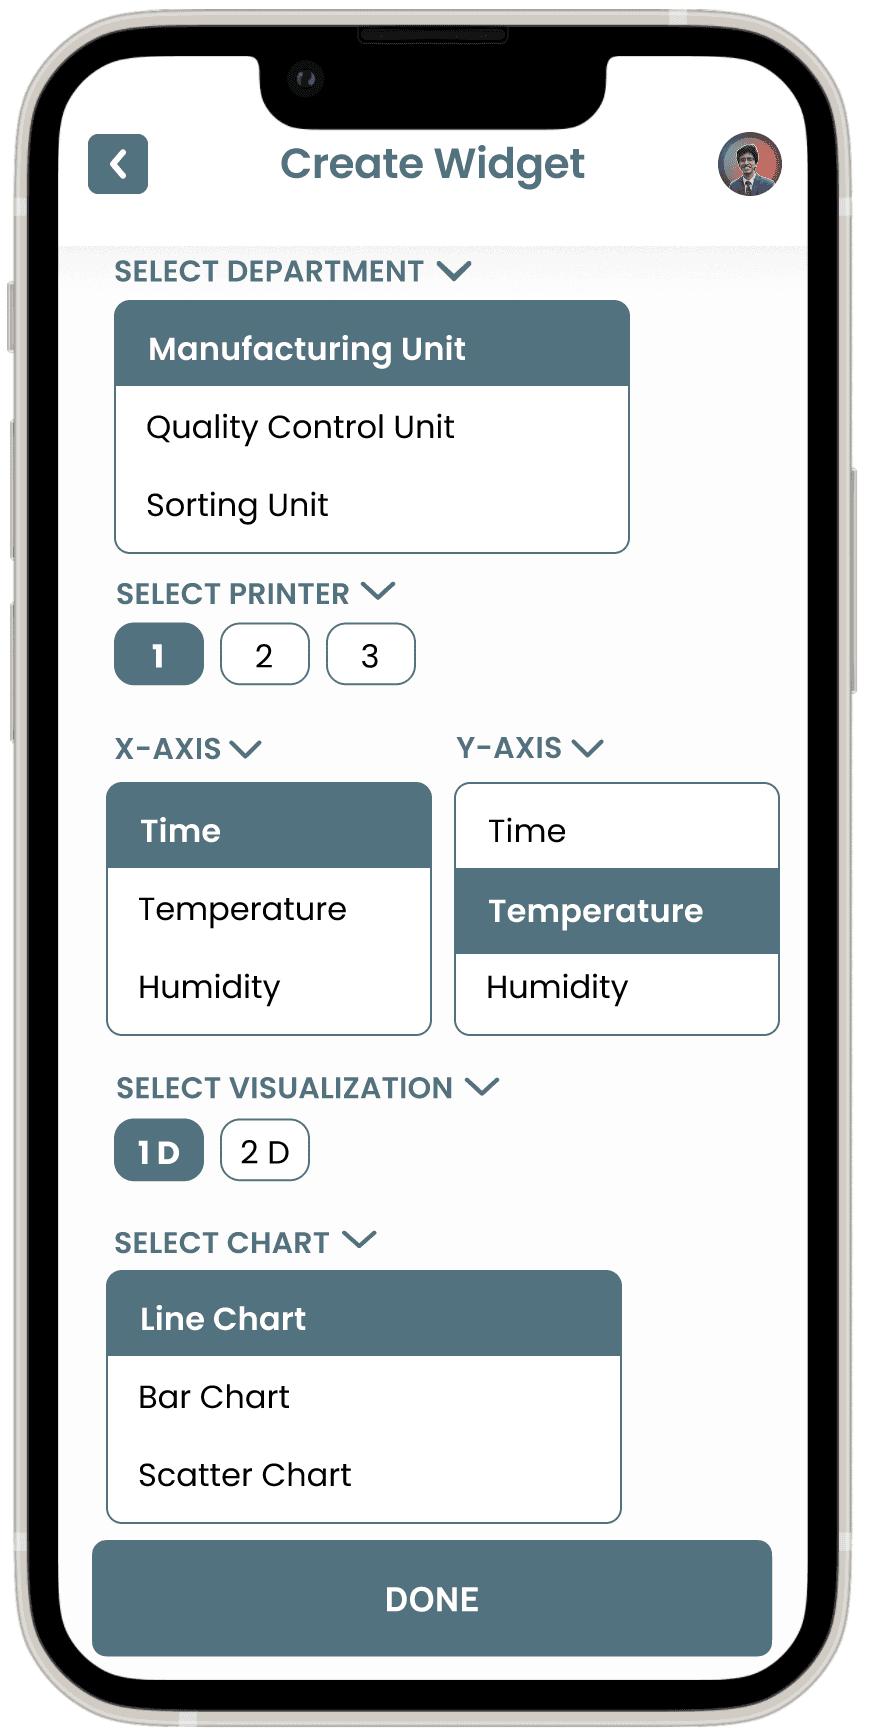
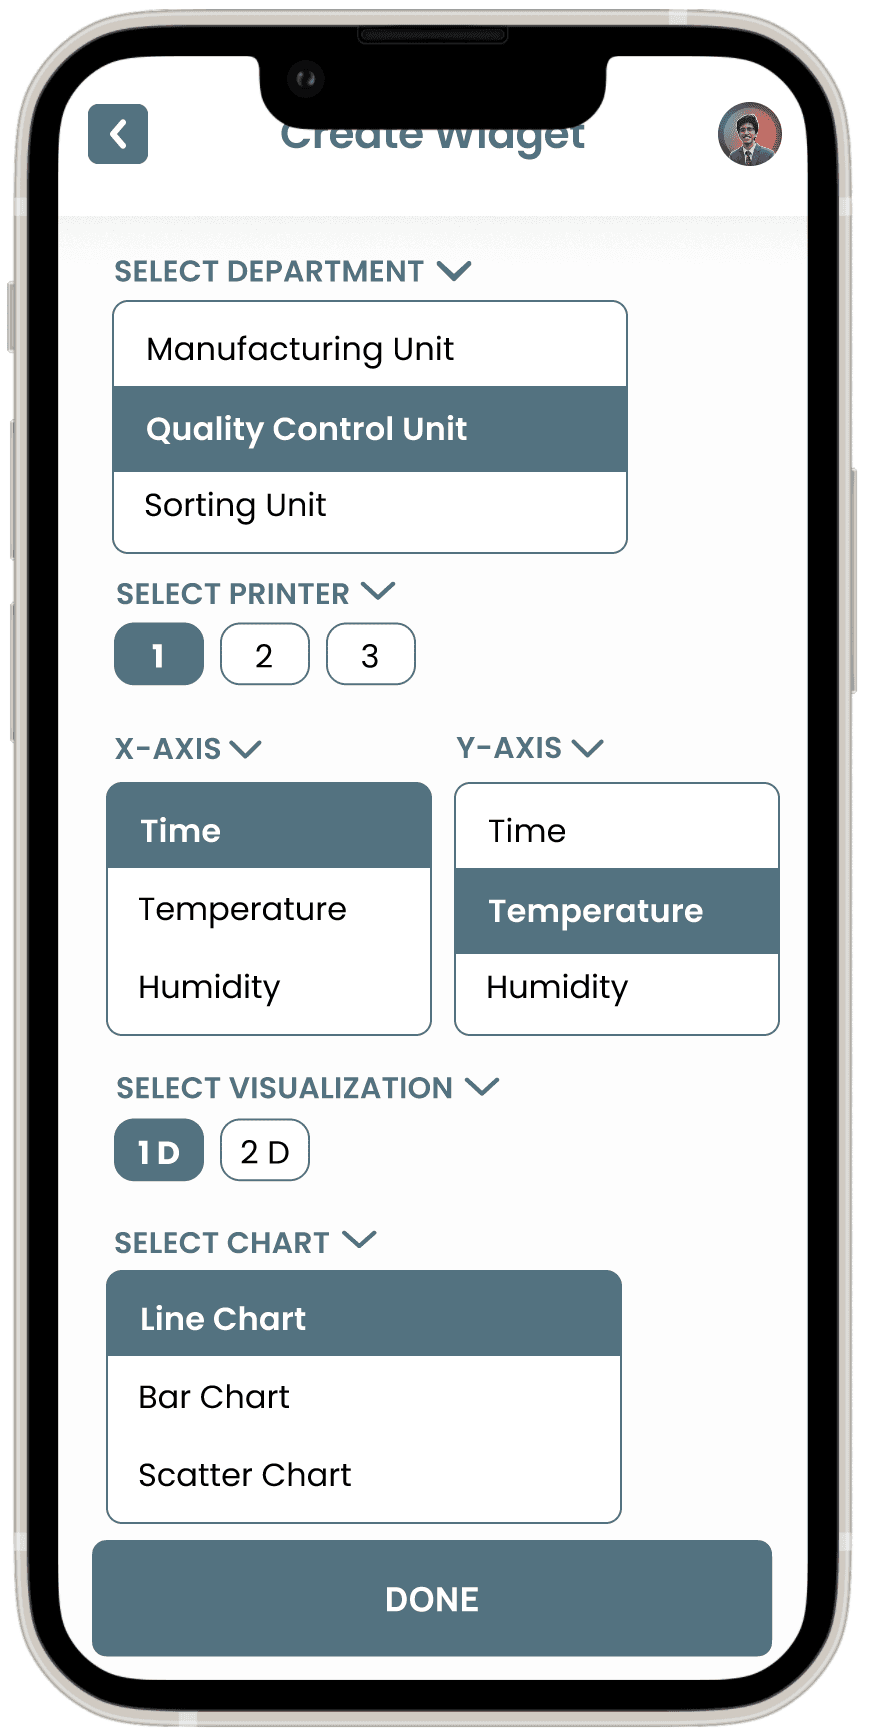
Customization & Widget Creation


Usability Test
Prototype
The Figma prototype for the Smart Factory application is designed to evaluate how effectively users can interact with the key functionalities of the app, particularly focusing on task completion, navigation, and user satisfaction. The goal is to identify any pain points in the user journey, areas where interaction can be improved, and to ensure the app meets the requirements of users working in industrial environments.
Verifying Value Sensitive Design (VSD) concept:
Application of VSD Principles: The Human-Computer Interaction (HCI) concept of Value Sensitive Design (VSD) was applied to the Smart Factory app to ensure integration of key user values such as transparency, control, and inclusivity.
Validation through Testing: The usability test verified that the design aligns with these values, promoting an ethical, user-centered experience while enhancing decision-making throughout the application.
Usability Test Plan
Objective: The primary objective of the usability test for the Smart Factory app is to assess the user interface, overall user experience, and the effectiveness of its features for managing and monitoring manufacturing processes in real time. The test aims to identify potential usability challenges, gather feedback on key functionalities, and ensure that the app upholds the principles of Value Sensitive Design (VSD), integrating user values such as transparency, control, and inclusivity.
Methodology: The test will be conducted with a moderated usability test approach. The participants, representative of the app's target audience, will perform a series of tasks within the Smart Factory app's prototype. The sessions will be a combination of in-person and remote testing, each lasting 20 minutes. Participants will use the app to simulate real-time monitoring and decision-making in manufacturing processes, while feedback is gathered on the app's design, workflow, and ease of use.
Participant Demographics:
Total Participants: 6
Age Range: 22-40 years old
Occupation: Engineers, plant managers, production supervisors
Experience: Users experienced in manufacturing, familiar with real-time data monitoring and management tools
Test Scenarios
Scenario 1: Monitoring Real-Time Data
Objective: Assess how easily users can view and interpret real-time data from various manufacturing units (e.g., temperature, moisture, humidity).
Task: Participants will navigate to the “Real-Time Data” dashboard, select different parameters for the manufacturing and quality control units, and interpret the provided data for decision-making.
Scenario 2: Creating a Custom Widget
Objective: Evaluate the ease with which users can customize widgets to display relevant manufacturing data.
Task: Participants will create a new widget for visualizing temperature and humidity data from the sorting unit, selecting preferred visualization types (e.g., line chart, bar chart) and applying filters.
Scenario 3: Managing Users and Roles
Objective: Test how intuitive it is for users to manage roles, permissions, and access control within the app.
Task: Participants will navigate to the “Users” section, create a new user with specific roles and permissions, and assign them to the appropriate departments within the factory.
Scenario 4: Analyzing and Comparing Data
Objective: Assess how effectively users can compare historical and real-time data for insights into manufacturing performance.
Task: Participants will use the “Comparison” feature to analyze data from the sorting and quality control units, comparing current metrics against historical performance and generating a report.
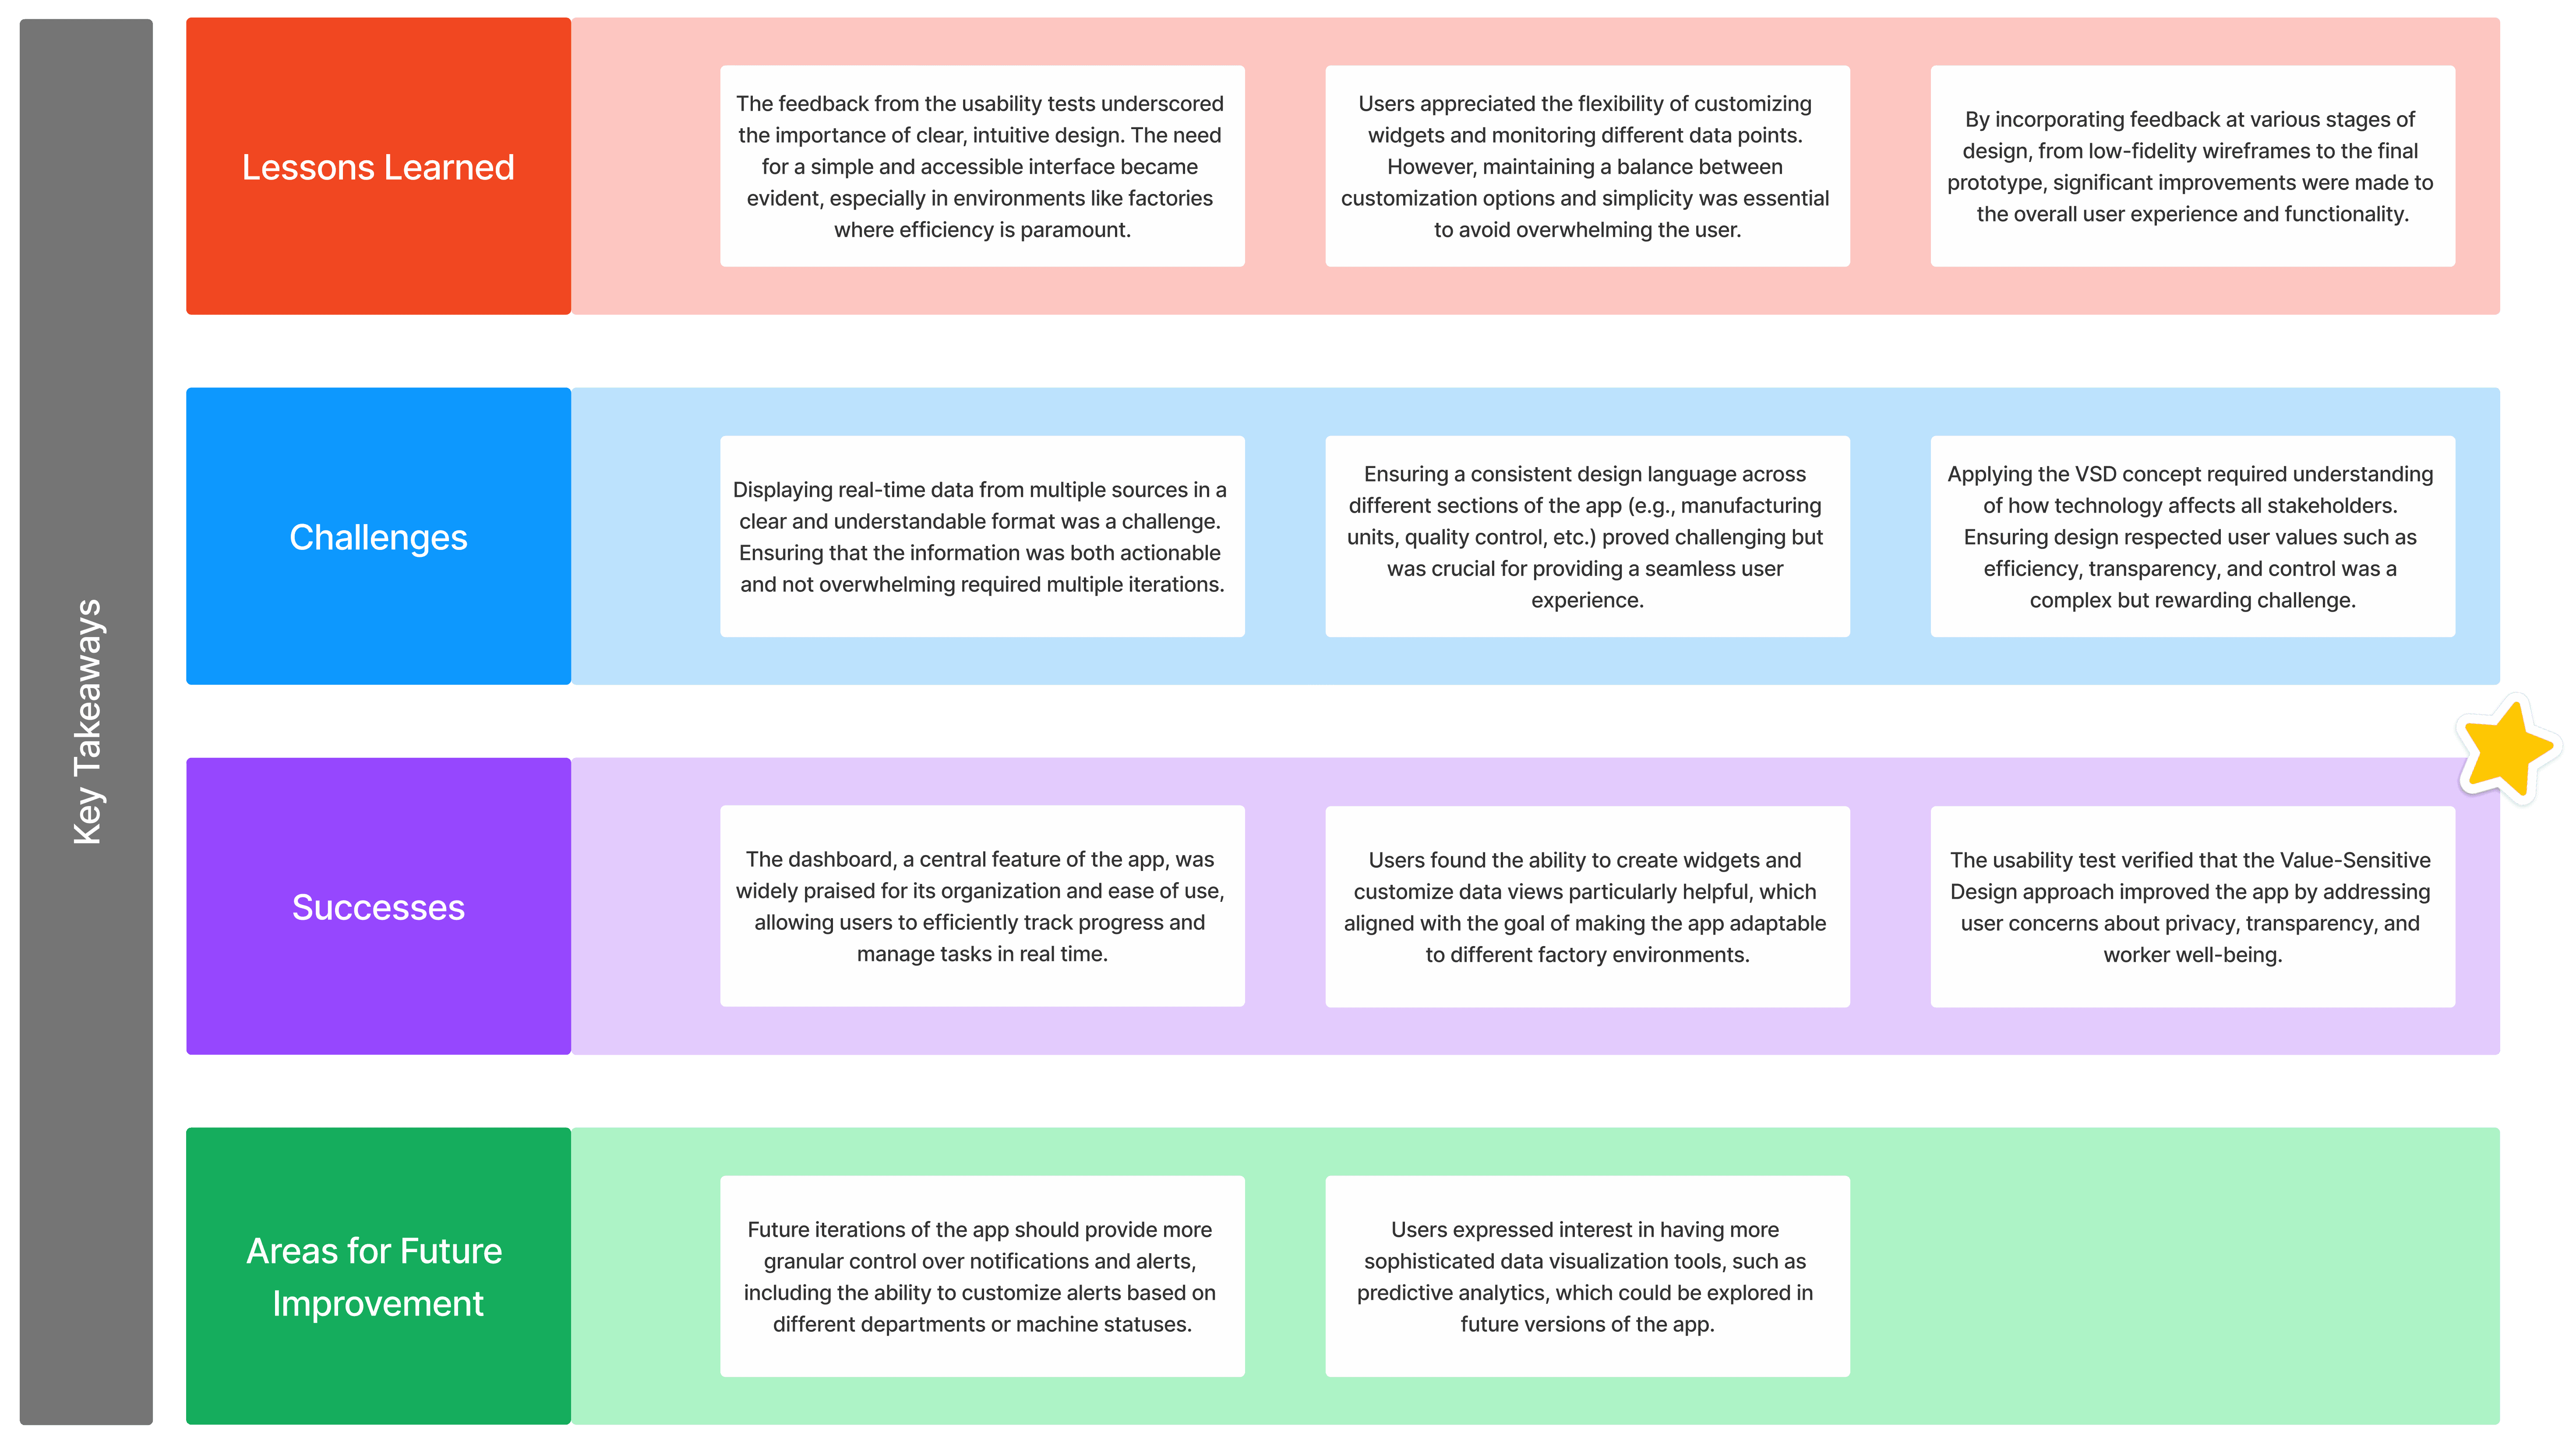
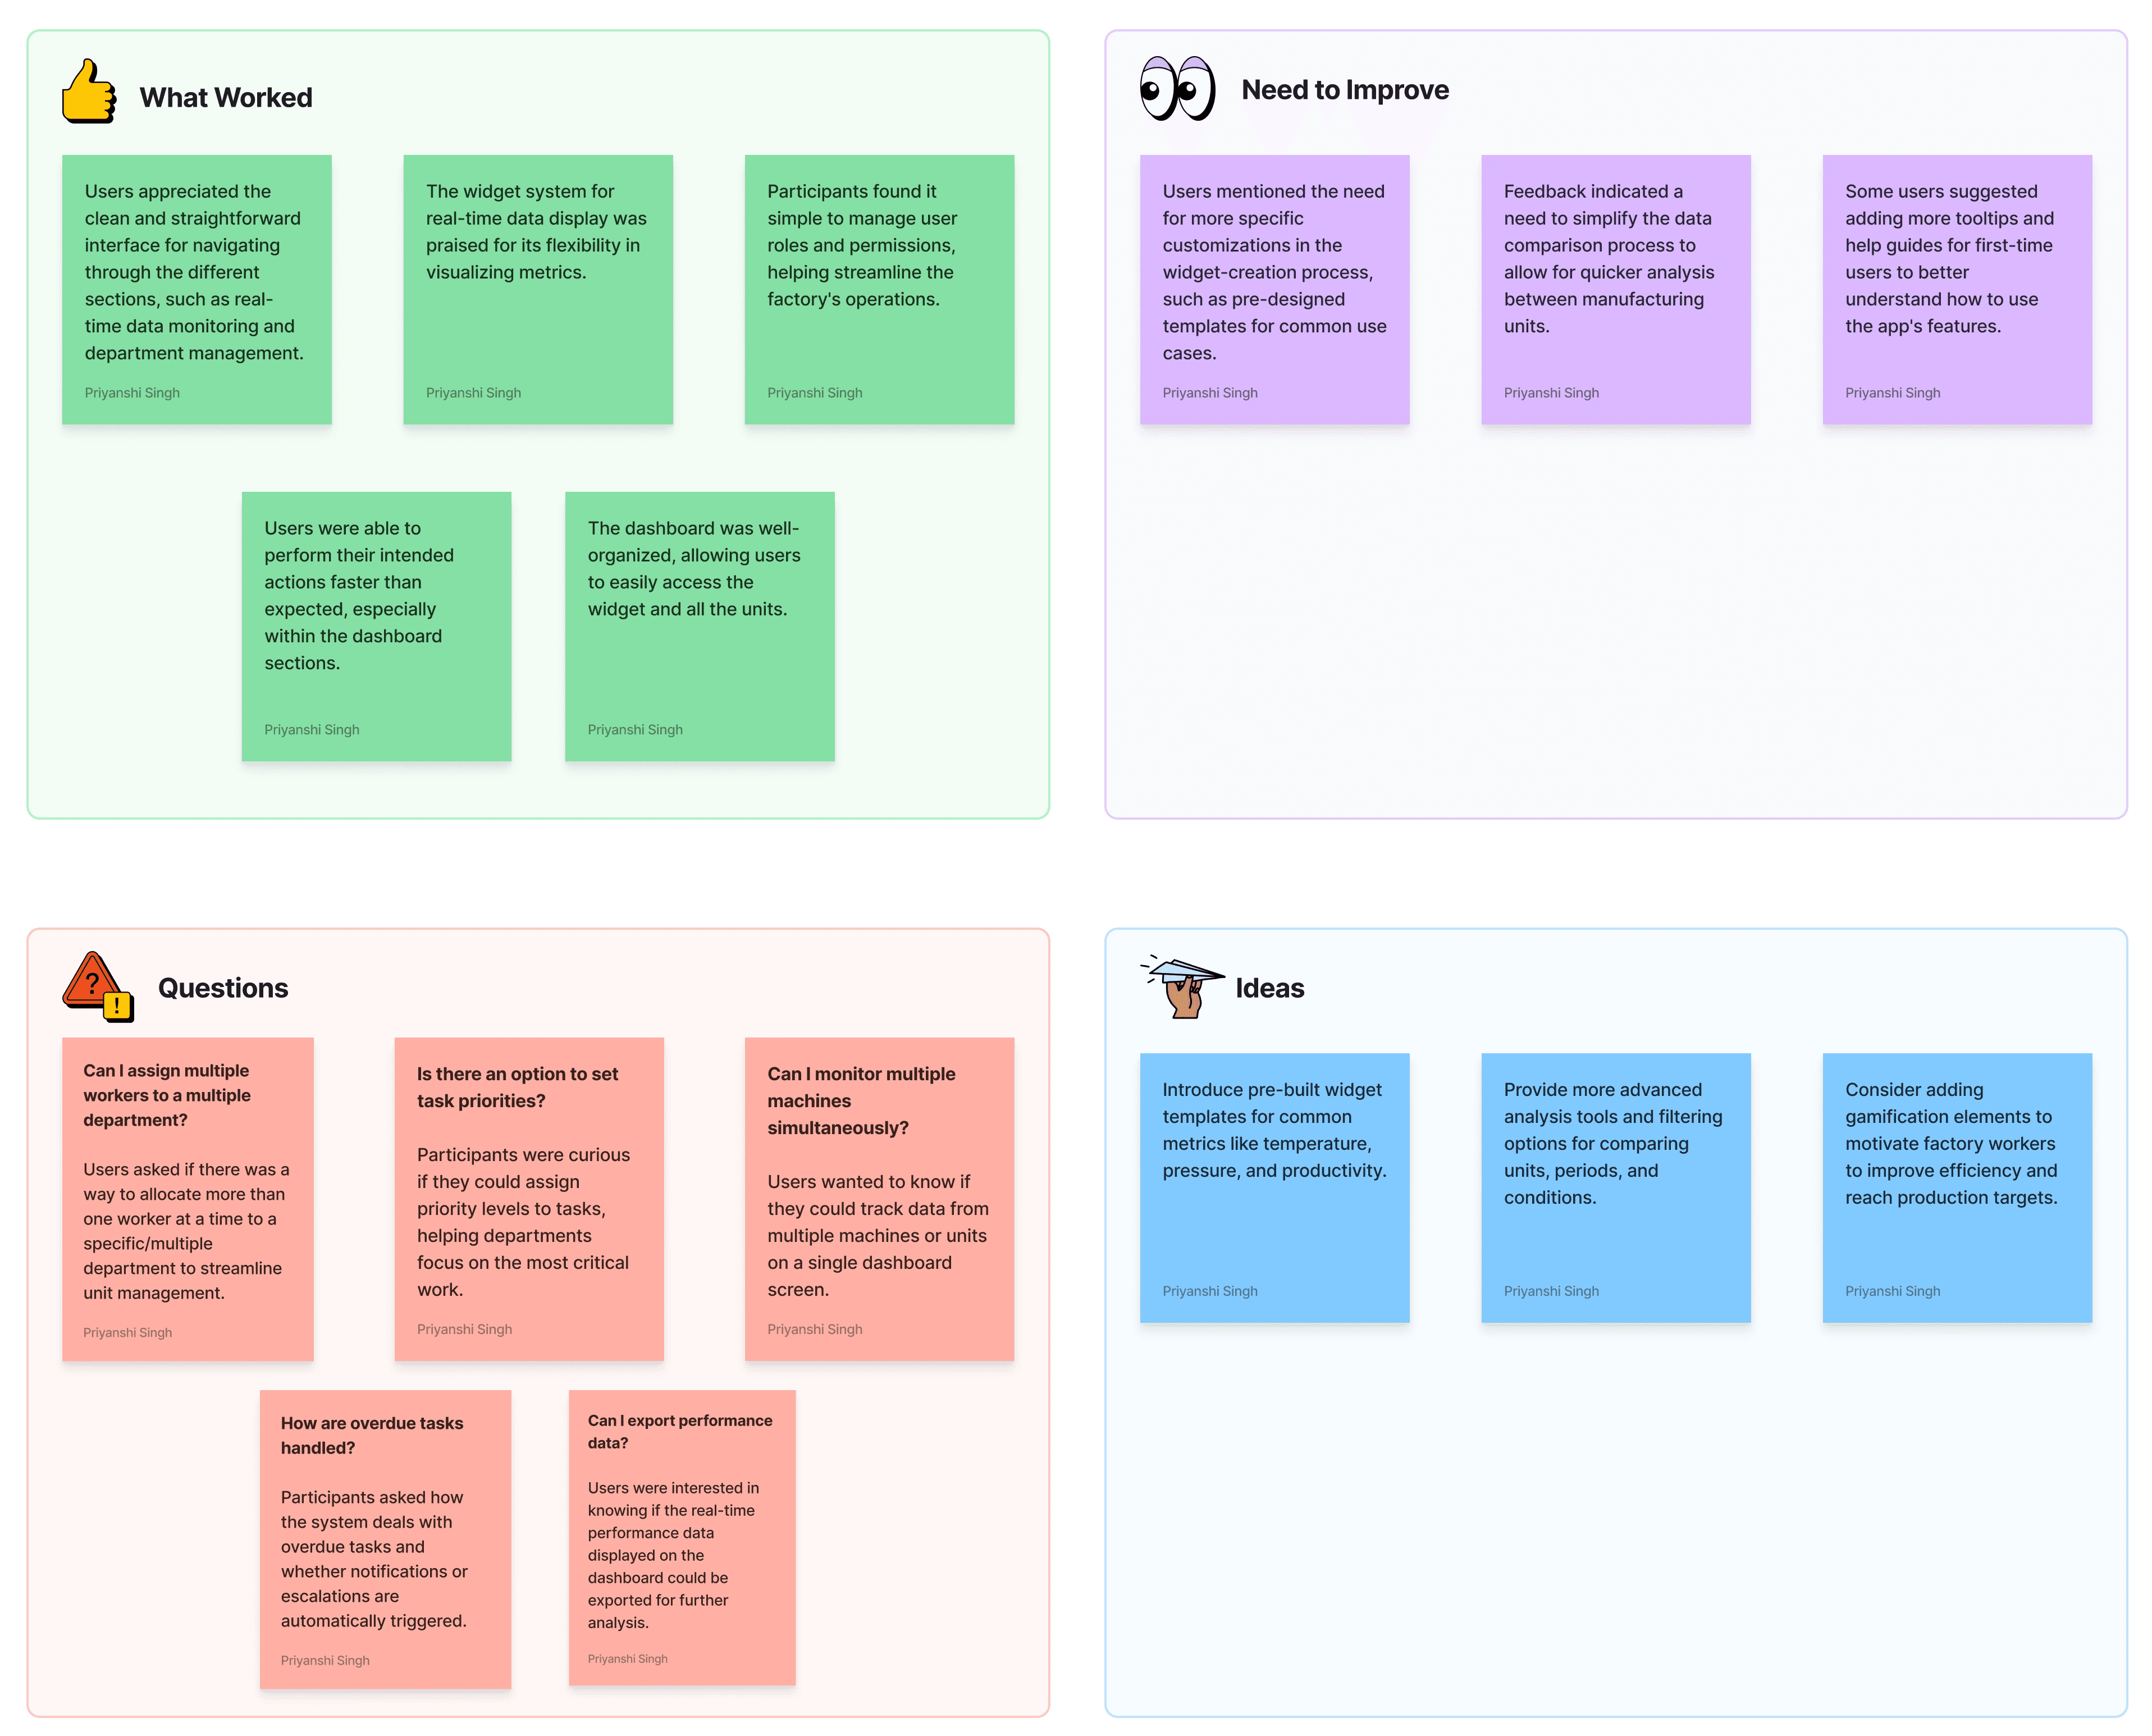
Conclusion
User-Friendly Interface: Participants found the app intuitive for real-time data monitoring and managing manufacturing processes.
Widget Customization: Feedback highlighted the need for more streamlined widget creation, though users appreciated the flexibility.
Role Management: User and role management features were well-received, with clear workflows for assigning permissions.
Data Comparison: Users suggested simplifying the data comparison process for faster analysis.
VSD Validation: The app effectively supports transparency, control, and inclusivity, aligning with the VSD principles.
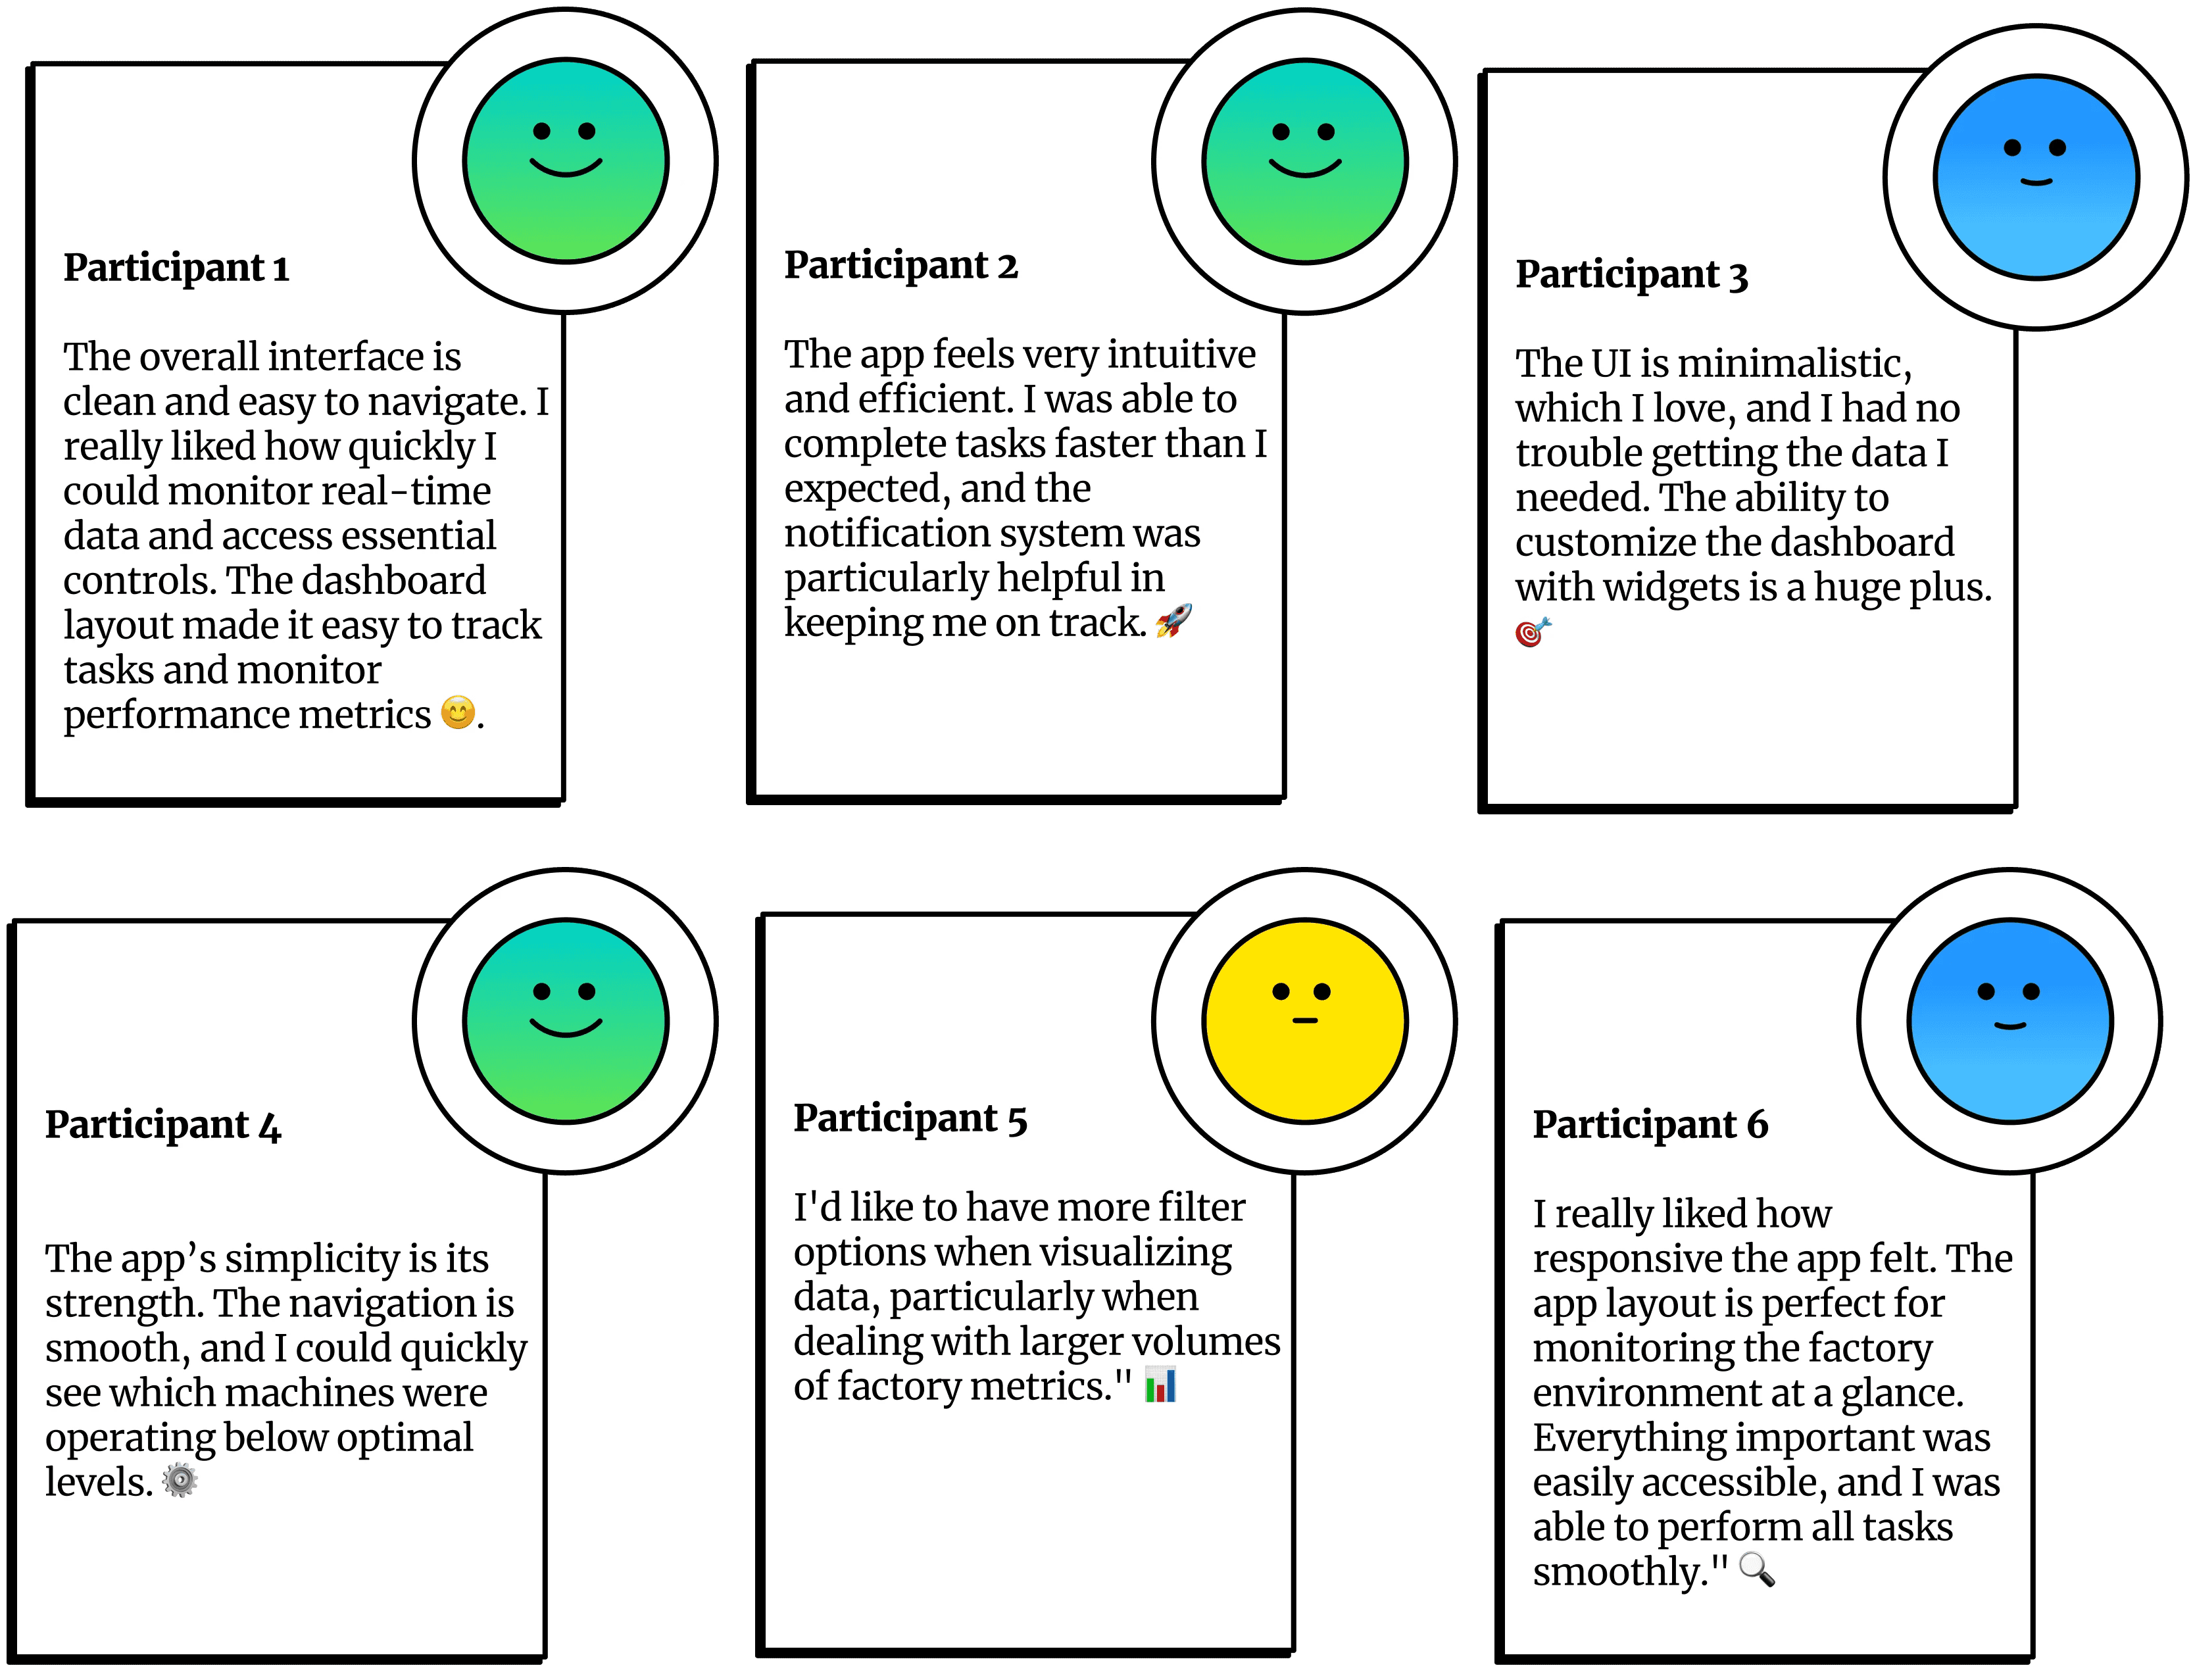
Final Prototype Feedback
Key Takeaways